50 EMA Trading Strategy: Simple Yet Powerful (Complete Guide) – 2026
The 50 EMA (Exponential Moving Average) is one of the most versatile and reliable indicators in forex trading. Despite its simplicity, professional traders worldwide use it as their primary tool for identifying trends, finding entry points, and managing trades. If you’re looking for a straightforward strategy that works across all currency pairs and timeframes, the 50 EMA strategy is exactly what you need.
In this comprehensive guide, you’ll learn everything about trading with the 50 EMA—from basic concepts to complete trading strategies with exact entry and exit rules. By the end, you’ll have a proven system you can start using immediately, whether you’re a day trader or swing trader.
What is the 50 EMA?
The 50 EMA (50-period Exponential Moving Average) is a technical indicator that calculates the average price of a currency pair over the last 50 periods, giving more weight to recent prices. This makes it more responsive to current price action than a simple moving average (SMA).
EMA vs SMA: Key Differences
Exponential Moving Average (EMA):
- Gives more weight to recent prices
- Reacts faster to price changes
- More responsive to current market conditions
- Better for dynamic support/resistance
- Preferred for trending markets
Simple Moving Average (SMA):
- Treats all prices equally
- Reacts slower to price changes
- More stable, less whipsaw
- Better for identifying long-term trends
- Preferred for slower timeframes
For active trading, the 50 EMA is superior because its responsiveness helps you catch trends earlier while still filtering out most noise.
Why the 50-Period Specifically?
The 50-period is the “Goldilocks” of moving averages:
- Too short (10-20 periods): Reacts too quickly, generates false signals, whipsaws frequently
- Too long (100-200 periods): Reacts too slowly, late entries, miss too much of the move
- Just right (50 periods): Perfect balance of responsiveness and reliability
The 50 EMA represents approximately 2-3 months of price data on daily charts, making it an excellent medium-term trend indicator.
How the 50 EMA Works as Dynamic Support and Resistance
The 50 EMA acts as a “magnetic” level that price gravitates toward during trends. Understanding this behavior is key to trading it successfully.
Dynamic Support in Uptrends
When price is trending upward:
- Price stays above the 50 EMA
- Pullbacks typically find support at or near the 50 EMA
- Each bounce off the 50 EMA is a buying opportunity
- The 50 EMA “follows” price upward, creating a rising floor
Think of it as: A rising escalator that catches you when you step back but keeps moving upward.
Dynamic Resistance in Downtrends
When price is trending downward:
- Price stays below the 50 EMA
- Rallies typically find resistance at or near the 50 EMA
- Each rejection from the 50 EMA is a selling opportunity
- The 50 EMA “follows” price downward, creating a falling ceiling
Think of it as: A descending escalator that pushes you down when you try to climb but keeps moving lower.
Range-Bound Markets
When price is not trending:
- Price repeatedly crosses above and below the 50 EMA
- The 50 EMA appears flat or choppy
- Generates many false signals (whipsaws)
- Best to avoid trading during these periods
The key insight: The 50 EMA is a trend-following tool. It excels in trending markets and struggles in ranging markets.
[LINK PLACEHOLDER: Internal link to “How to Identify Forex Trends on Multiple Timeframes”]
The Complete 50 EMA Trading Strategy
Let’s break down the complete strategy with exact rules you can follow step by step.
Strategy Overview
Trading Style: Trend-following pullback strategy Timeframes: 4-hour and daily (most reliable) Currency Pairs: All major pairs (EUR/USD, GBP/USD, USD/JPY, etc.) Win Rate: 60-70% with proper execution Risk-Reward: Minimum 1:2, typically 1:3 Best For: Swing traders and active day traders
Required Indicators
Primary Indicator:
- 50 EMA (exponential, applied to close)
- Color: Blue or red depending on trend direction
Optional Confirmation (Highly Recommended):
- 200 EMA (for major trend direction)
- RSI (14) (for momentum confirmation)
- Stochastic Oscillator (for timing entries)
Chart Setup
Step-by-Step Setup:
- Open your trading platform (MT4, MT5, TradingView, etc.)
- Select your currency pair
- Choose your timeframe (4-hour or daily recommended)
- Add 50 EMA indicator (exponential, period: 50, apply to: close)
- Optional: Add 200 EMA for major trend context
- Remove all other indicators to keep chart clean
- Adjust colors for easy visualization
Your chart should now clearly show price candles and the 50 EMA line moving through price history.
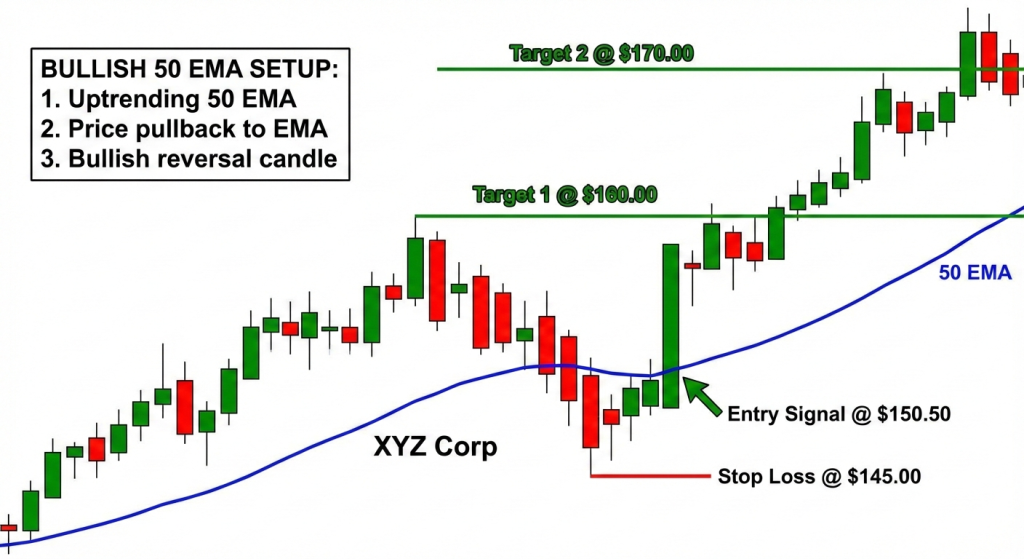
Bullish 50 EMA Strategy (Buy Setup)
Entry Conditions – ALL Must Be Met
Condition 1: Trend Confirmation
- Price must be trading above the 50 EMA
- 50 EMA must be sloping upward (indicating uptrend)
- Higher highs and higher lows on price chart
- If using 200 EMA: 50 EMA should be above 200 EMA
Condition 2: Pullback to 50 EMA
- Price pulls back from highs toward the 50 EMA
- Price touches, bounces off, or slightly penetrates the 50 EMA (1-5 pips)
- This pullback creates the buying opportunity
Condition 3: Momentum Confirmation (Optional but Recommended)
- RSI dips below 50 during pullback, then turns up
- OR Stochastic enters oversold (<20), then crosses upward
- This confirms momentum is shifting back to bullish
Condition 4: Bullish Candle Confirmation
- Wait for a strong bullish candle to close
- Candle should close above the 50 EMA
- Ideal: Bullish engulfing, pin bar, or hammer pattern
- This confirms buyers are stepping in
Entry Rules
Entry Trigger Options:
Option 1: Conservative (Recommended for Beginners)
- Enter at the open of the next candle after the bullish confirmation candle
- This ensures you’re not entering too early
Option 2: Aggressive (For Experienced Traders)
- Place a buy stop order 3-5 pips above the high of the confirmation candle
- Gets you in earlier if price continues upward strongly
Option 3: Limit Order (For Patient Traders)
- If price bounces before touching 50 EMA, place buy limit order at 50 EMA
- Only fills if price comes back to exact 50 EMA level
- Risk missing some trades but excellent price on fills
Stop Loss Placement
Conservative Stop Loss:
- Place 10-20 pips below the 50 EMA
- OR below the swing low that formed during the pullback
- Gives the trade breathing room
Aggressive Stop Loss:
- Place 5-10 pips below the low of the entry candle
- Tighter stop means better risk-reward but higher stop-out rate
- Only use during strong trends with clear bounces
Maximum Stop Loss:
- Never risk more than 2% of your account
- If stop distance exceeds 2% risk, reduce position size accordingly
Take Profit Targets
Target 1: 50% Position Close
- Recent swing high (resistance level)
- OR 2× your stop loss distance (2:1 risk-reward)
- Secures partial profits
Target 2: 50% Position Close
- Next major resistance level
- OR 3× your stop loss distance (3:1 risk-reward)
- Lets winners run
Alternative: Single Target
- Close entire position at 2.5-3× risk
- Simpler to manage
- More consistent
Trade Management
After Entry:
When price moves 50% toward Target 1:
- Move stop loss to break-even (entry price)
- This creates a “risk-free” trade
When Target 1 is hit:
- Close 50% of position
- Move stop loss on remaining position to just below recent swing low
- Let trade run toward Target 2
Trailing Stop (Advanced):
- As price makes higher highs, trail stop below each new swing low
- Keeps you in trend longer
- Exit when price closes below 50 EMA
Exit Signals:
- Price closes below 50 EMA = Exit immediately
- Bearish divergence appears on RSI = Consider exiting
- Price fails to make new high after pullback = Exit
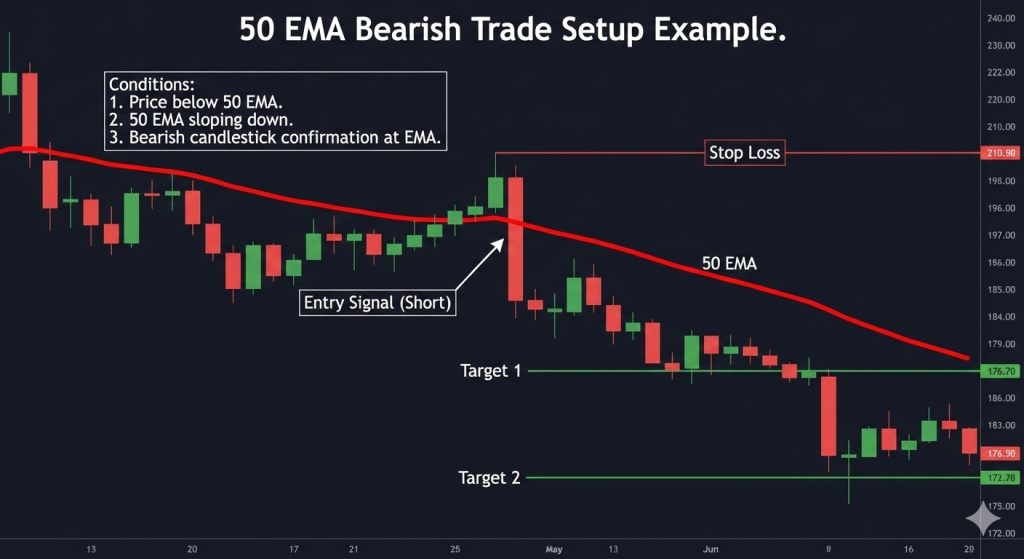
Bearish 50 EMA Strategy (Sell Setup)
Entry Conditions – ALL Must Be Met
Condition 1: Trend Confirmation
- Price must be trading below the 50 EMA
- 50 EMA must be sloping downward (indicating downtrend)
- Lower highs and lower lows on price chart
- If using 200 EMA: 50 EMA should be below 200 EMA
Condition 2: Pullback to 50 EMA
- Price rallies from lows up toward the 50 EMA
- Price touches, gets rejected by, or slightly penetrates the 50 EMA (1-5 pips)
- This rally creates the selling opportunity
Condition 3: Momentum Confirmation (Optional but Recommended)
- RSI rises above 50 during pullback, then turns down
- OR Stochastic enters overbought (>80), then crosses downward
- Confirms momentum shifting back to bearish
Condition 4: Bearish Candle Confirmation
- Wait for a strong bearish candle to close
- Candle should close below the 50 EMA
- Ideal: Bearish engulfing, shooting star, or evening star
- Confirms sellers are in control
Entry Rules
Entry Trigger Options:
Option 1: Conservative
- Enter at the open of the next candle after bearish confirmation
- Safest approach
Option 2: Aggressive
- Place sell stop order 3-5 pips below the low of confirmation candle
- Earlier entry if momentum continues
Option 3: Limit Order
- Place sell limit at 50 EMA if price hasn’t quite reached it
- Best price but might miss some trades
Stop Loss Placement
Conservative Stop Loss:
- Place 10-20 pips above the 50 EMA
- OR above the swing high that formed during the rally
- Adequate protection
Aggressive Stop Loss:
- Place 5-10 pips above the high of entry candle
- Tighter risk but higher stop-out chance
Maximum Stop Loss:
- Never exceed 2% account risk
- Adjust position size if stop distance is large
Take Profit Targets
Target 1: 50% Position
- Recent swing low (support level)
- OR 2× stop loss distance
- Secure partial profits
Target 2: 50% Position
- Next major support level
- OR 3× stop loss distance
- Capture extended moves
Alternative: Single Target
- 2.5-3× stop loss distance
- Entire position closed
Trade Management
After Entry:
At 50% progress to Target 1:
- Move stop to break-even
When Target 1 hit:
- Close 50% position
- Trail stop just above recent swing highs
Trailing Stop:
- Trail above each new swing high
- Exit when price closes above 50 EMA
Exit Signals:
- Price closes above 50 EMA
- Bullish divergence on RSI
- Price fails to make new low after rally
Real Trading Examples – Step by Step
Example 1: EUR/USD Bullish Trade
Setup Details:
- Pair: EUR/USD
- Timeframe: 4-Hour Chart
- Date: Mid-November 2023
Market Context:
- EUR/USD in uptrend for 3 weeks
- 50 EMA sloping upward
- Price making higher highs and higher lows
Trade Development:
Stage 1: Trend Identification (November 10)
- Price clearly above 50 EMA
- 50 EMA angle: +15 degrees (strong uptrend)
- Multiple successful bounces off 50 EMA already
Stage 2: Pullback Formation (November 13-14)
- Price peaks at 1.0880
- Pulls back toward 50 EMA over 12 hours
- 50 EMA level: 1.0820
Stage 3: Bounce Setup (November 14, 4:00 PM)
- Price touches 50 EMA at 1.0822
- Forms a bullish hammer candle
- RSI drops to 45, then turns upward
- Next candle opens at 1.0830
Trade Execution:
Entry: 1.0830 (next candle open after hammer) Stop Loss: 1.0805 (15 pips below 50 EMA) Risk: 25 pips
Targets:
- Target 1: 1.0880 (recent high, 50 pips = 2:1 RR)
- Target 2: 1.0930 (next resistance, 100 pips = 4:1 RR)
Trade Management:
November 15, 8:00 AM:
- Price reaches 1.0855 (+25 pips, 50% to Target 1)
- Move stop to 1.0830 (break-even)
November 15, 8:00 PM:
- Target 1 hit at 1.0880
- Close 50% for +50 pips profit
- Move stop to 1.0850 on remaining position
November 17, 12:00 PM:
- Target 2 hit at 1.0930
- Close remaining 50% for +100 pips profit
Final Results:
- Total profit: (50 + 100) ÷ 2 = 75 pips average
- Risk-reward: 3:1
- Position held: 3 days
- Account gain: 3% (on 2% risk)
Key Success Factors:
- Clean uptrend with rising 50 EMA
- Perfect bounce exactly at 50 EMA
- Strong bullish hammer confirmation
- Patient trade management
- Let winners run to Target 2
Example 2: GBP/USD Bearish Trade
Setup Details:
- Pair: GBP/USD
- Timeframe: Daily Chart
- Date: Early December 2023
Market Context:
- GBP/USD in downtrend for 2 months
- 50 EMA sloping downward
- Price below 50 EMA, making lower lows
Trade Development:
Stage 1: Trend Identification (December 1)
- Price clearly below 50 EMA
- 50 EMA angle: -20 degrees (strong downtrend)
- Consistent rejections from 50 EMA
Stage 2: Rally Formation (December 4-6)
- Price bottoms at 1.2520
- Rallies toward 50 EMA over 3 days
- 50 EMA level: 1.2635
Stage 3: Rejection Setup (December 6)
- Price reaches 1.2640 (5 pips above 50 EMA)
- Forms a bearish engulfing candle
- RSI peaks at 58, then turns down
- Stochastic in overbought, crosses down
Trade Execution:
Entry: 1.2625 (next day open) Stop Loss: 1.2665 (30 pips above 50 EMA) Risk: 40 pips
Targets:
- Target 1: 1.2545 (recent low, 80 pips = 2:1 RR)
- Target 2: 1.2485 (major support, 140 pips = 3.5:1 RR)
Trade Management:
December 7:
- Price drops to 1.2585 (-40 pips, 50% to Target 1)
- Move stop to 1.2625 (break-even)
December 9:
- Target 1 hit at 1.2545
- Close 50% for +80 pips
- Trail stop to 1.2600 (above recent swing high)
December 12:
- Target 2 hit at 1.2485
- Close remaining 50% for +140 pips
Final Results:
- Total profit: (80 + 140) ÷ 2 = 110 pips average
- Risk-reward: 2.75:1
- Position held: 6 days
- Account gain: 2.75% (on 2% risk)
Key Success Factors:
- Strong established downtrend
- Clean rejection right at 50 EMA
- Multiple confirmations (engulfing + RSI + Stochastic)
- Daily timeframe provided clear signal
- Trailing stop captured extended move
[IMAGE PLACEHOLDER: Side-by-side charts showing both EUR/USD bullish and GBP/USD bearish trade examples – Alt text: “Real 50 EMA trading examples showing successful bullish and bearish setups”]
Example 3: USD/JPY False Signal (Loser)
Setup Details:
- Pair: USD/JPY
- Timeframe: 4-Hour Chart
- Date: Late December 2023
Market Context:
- USD/JPY attempting to establish uptrend
- 50 EMA just starting to slope upward
- Recent choppy price action
Trade Development:
Stage 1: Questionable Trend
- Price recently crossed above 50 EMA
- 50 EMA slope: Only +5 degrees (weak trend)
- Only one prior bounce off 50 EMA
Stage 2: Pullback
- Price pulls back to 50 EMA at 149.20
- Forms small bullish candle (not strong pattern)
- RSI at 52 (not oversold, minimal confirmation)
Stage 3: Entry (Mistake)
- Entered despite weak confirmation
- Entry: 149.25
- Stop: 149.00 (25 pips below)
- Target: 149.75 (50 pips, 2:1 RR)
What Went Wrong:
December 27:
- Instead of bouncing, price consolidated sideways
- 50 EMA caught up to price (flattening)
December 28:
- Price broke below 50 EMA
- Stop loss hit at 149.00
- Loss: -25 pips
Post-Analysis:
Mistakes Made:
- Weak trend – 50 EMA barely sloping, not established uptrend
- Poor confirmation – Small candle, RSI not oversold
- Insufficient history – Only one prior bounce, not enough pattern
- Impatience – Forced a trade that didn’t meet all criteria
Correct Action:
- Should have waited for stronger trend establishment
- Needed clearer bounce with better confirmation
- Should have skipped this marginal setup
Key Lesson: Not every touch of the 50 EMA is a valid trade. Trend strength and confirmation quality matter enormously. This -25 pip loss (2% account risk) was acceptable and manageable—proper risk management kept the loss small.
Best Timeframes for 50 EMA Strategy
The 50 EMA works on all timeframes, but effectiveness varies significantly.
Most Reliable: Daily Chart
Advantages:
- Clearest trend signals
- Fewest false breakouts
- Best risk-reward ratios
- Less screen time required
- 1-2 quality setups per pair per month
Disadvantages:
- Fewer trading opportunities
- Requires patience
- Wider stop losses (30-50 pips typical)
- Positions held days/weeks
Best For: Swing traders, part-time traders, beginners
Win Rate: 65-75%
Good Balance: 4-Hour Chart
Advantages:
- More frequent setups (1-2 per week)
- Still reliable signals
- Moderate stop losses (20-40 pips)
- Good for active traders
- Positions held 1-5 days
Disadvantages:
- More monitoring required
- Slightly more false signals than daily
- Can miss extended moves due to shorter horizon
Best For: Active swing traders, serious part-timers
Win Rate: 60-70%
Acceptable: 1-Hour Chart
Advantages:
- Many setups daily
- Shorter holding periods (hours to 1 day)
- Tighter stops (15-25 pips)
- Active trading opportunities
Disadvantages:
- More false signals
- Requires constant monitoring
- More affected by news and volatility
- Lower win rate
Best For: Day traders with time to monitor
Win Rate: 55-65%
Not Recommended: 15-Minute and Below
Issues:
- Excessive false signals
- High spread cost impact
- Constant whipsaws
- Difficult to distinguish trend from noise
- Very low win rate (45-55%)
Exception: Experienced scalpers might use 50 EMA for trend direction only, not entries
[LINK PLACEHOLDER: Internal link to “Forex Trading Hours: Best Time to Trade Each Currency Pair”]
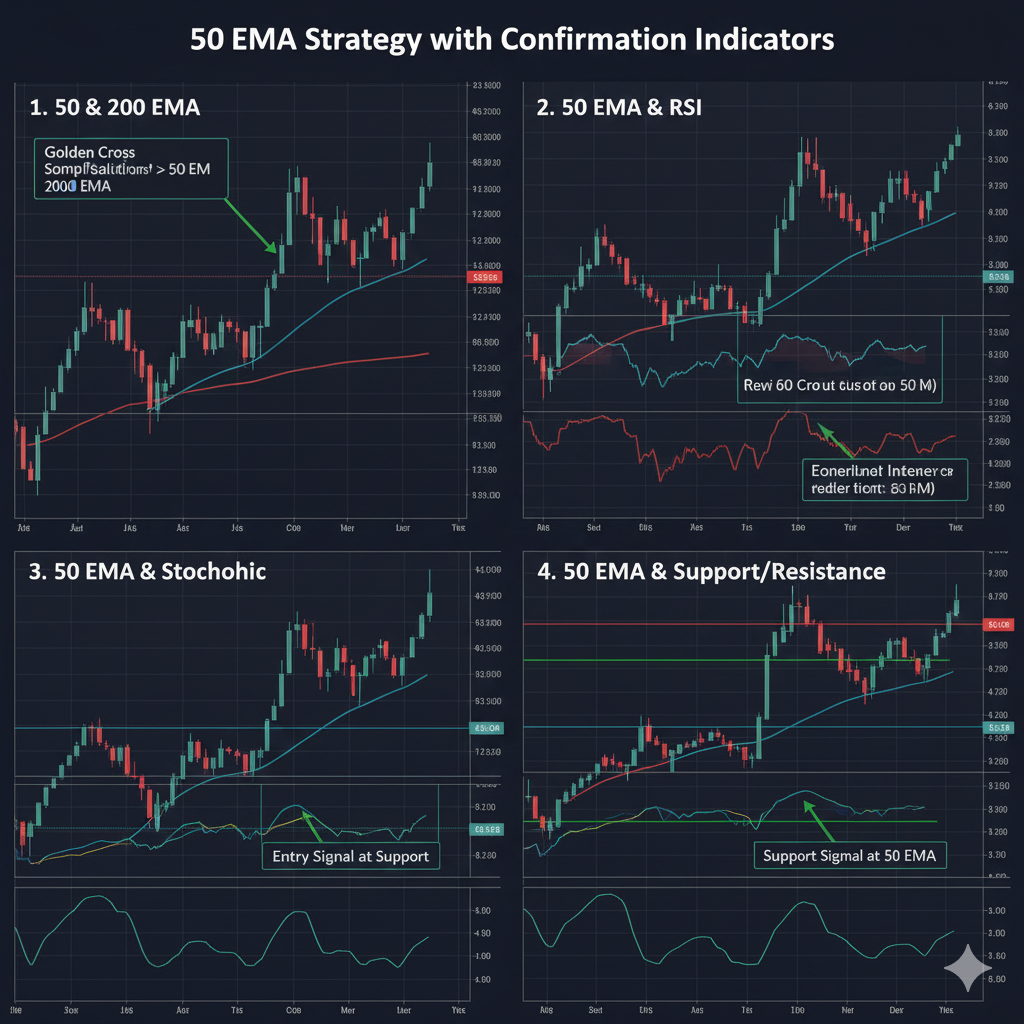
Combining 50 EMA with Other Indicators
While the 50 EMA is powerful alone, adding confirmation increases win rate.
50 EMA + 200 EMA (Moving Average Crossover)
How It Works:
- Add both 50 EMA and 200 EMA to chart
- When 50 EMA crosses above 200 EMA = Golden Cross (bullish)
- When 50 EMA crosses below 200 EMA = Death Cross (bearish)
Trading Application:
- Only take long trades when 50 EMA > 200 EMA
- Only take short trades when 50 EMA < 200 EMA
- This filters trades to align with major trend
Benefits:
- Keeps you on right side of trend
- Eliminates counter-trend trades
- Higher win rate (typically +5-10%)
Drawback:
- Miss early trend entries
- Fewer total trades
50 EMA + RSI (14)
How It Works:
- Use 50 EMA for trend and entry
- Use RSI for timing and confirmation
For Long Trades:
- Wait for RSI to dip below 50 during pullback
- Enter when RSI turns back above 50 with 50 EMA bounce
- Confirms momentum aligning with entry
For Short Trades:
- Wait for RSI to rise above 50 during rally
- Enter when RSI turns below 50 with 50 EMA rejection
- Confirms bearish momentum
Benefits:
- Better entry timing
- Avoids premature entries
- Confirms momentum shift
[LINK PLACEHOLDER: Internal link to “RSI Divergence Trading Strategy: How to Spot Reversals”]
50 EMA + Stochastic (14, 3, 3)
How It Works:
- 50 EMA identifies trend and entry area
- Stochastic times precise entry
For Long Trades:
- During pullback to 50 EMA
- Wait for Stochastic to enter oversold (<20)
- Enter when Stochastic crosses upward
For Short Trades:
- During rally to 50 EMA
- Wait for Stochastic to enter overbought (>80)
- Enter when Stochastic crosses downward
Benefits:
- Excellent entry timing
- Catches bounces/rejections early
- Very clear entry signals
50 EMA + Support/Resistance Levels
How It Works:
- Mark major S/R zones on higher timeframes
- Look for 50 EMA to align with S/R levels
- Trade only when 50 EMA bounce/rejection occurs AT S/R
Example:
- 50 EMA bounce at 1.1000 psychological level = A+ long setup
- 50 EMA rejection at previous swing high = A+ short setup
Benefits:
- Massive confluence
- Highest win rate setups
- Best risk-reward ratios
Position Sizing for 50 EMA Trades
Proper position sizing is critical for long-term success.
The 2% Risk Rule
Never risk more than 2% of your account on any single trade.
Formula: Position Size = (Account Balance × Risk %) ÷ Stop Loss (pips)
Example 1:
- Account: $10,000
- Risk: 2% = $200
- Stop Loss: 40 pips
- Position Size: $200 ÷ 40 = $5 per pip = 0.5 lots (50,000 units)
Example 2:
- Account: $5,000
- Risk: 1.5% = $75
- Stop Loss: 25 pips
- Position Size: $75 ÷ 25 = $3 per pip = 0.3 lots (30,000 units)
Adjusting for Timeframe
Daily Chart Trades:
- Wider stops (30-50 pips typical)
- Smaller position sizes
- Longer hold times
- Higher win rate compensates
4-Hour Chart Trades:
- Moderate stops (20-40 pips)
- Medium position sizes
- Moderate hold times
- Balanced approach
Multiple Positions
If trading multiple pairs:
- Maximum combined risk: 6% of the account
- No more than 3 correlated positions
- Example: EUR/USD, GBP/USD, EUR/GBP are highly correlated—choose 1-2 max
Scaling In (Advanced)
Some traders add to winning positions:
Method:
- Enter 50% position at first bounce
- Add remaining 50% at second bounce if still valid
- Keep total risk under 2%
Benefits:
- Better average entry price if first entry too early
- Reduces risk of single bad entry
Risks:
- Can miss entire second entry
- Complicated for beginners
Recommendation: Master single entries first before attempting scaling strategies.
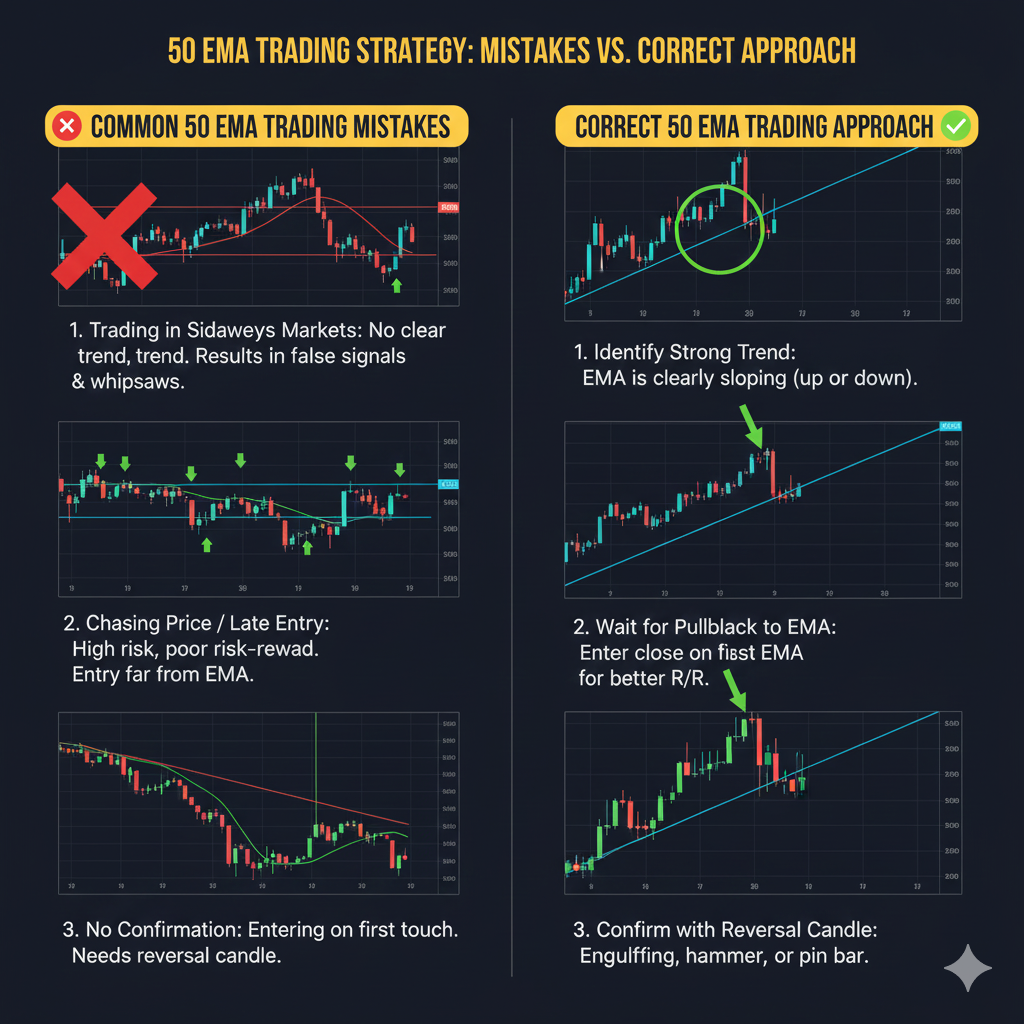
Common Mistakes and How to Avoid Them
Mistake #1: Trading Against the 50 EMA Slope
The Problem: Taking long trades when 50 EMA is flat or declining, or shorts when 50 EMA is flat or rising.
Why It Fails: The 50 EMA slope indicates trend strength. Flat or contrary slope = weak or absent trend.
The Fix:
- Bullish trades: 50 EMA MUST be sloping upward (visually obvious)
- Bearish trades: 50 EMA MUST be sloping downward
- Flat 50 EMA: Avoid trading, market is ranging
Mistake #2: Entering Before Price Touches 50 EMA
The Problem: “Price is getting close to the 50 EMA, I’ll enter now before it bounces!”
Why It Fails: Price might not reach 50 EMA, might blow through it, or might consolidate there for hours/days.
The Fix:
- Wait for actual touch or penetration
- Confirm the bounce/rejection with a candle close
- Patience prevents premature entries
Mistake #3: Ignoring Confirmation Candles
The Problem: Entering as soon as price touches 50 EMA without waiting for reversal candle.
Why It Fails: Touch doesn’t guarantee bounce. Need confirmation that buyers/sellers are actually stepping in.
The Fix:
- Always wait for bullish/bearish candle close
- Look for strong patterns (engulfing, pin bars)
- Confirmation = price is actually reversing
Mistake #4: Using Too Small Timeframes
The Problem: Trading 50 EMA on 5-minute or 15-minute charts.
Why It Fails: Too much noise, false signals dominate, spread costs eat profits.
The Fix:
- Stick to 4-hour minimum (1-hour if experienced)
- Daily chart ideal for beginners
- Lower timeframes = lower win rates
Mistake #5: Not Respecting the Trend
The Problem: Shorting because “price looks high” even though 50 EMA is rising steeply.
Why It Fails: Fighting the trend is the fastest way to lose money. Trends can continue far longer than seems logical.
The Fix:
- Trend is your friend—trade WITH the 50 EMA slope
- Only consider counter-trend at extreme levels with multiple confirmations
- When in doubt, trade with the trend
Mistake #6: Moving Stop Losses Wider
The Problem: “Price is only 5 pips from my stop… maybe it will bounce. Let me move the stop.”
Why It Fails: You’ve already been proven wrong. Moving stops turns small losses into large ones.
The Fix:
- Set stop and leave it
- Can move it closer (to break-even) but NEVER wider
- If stopped out, accept it and wait for next setup
Advanced 50 EMA Techniques
Once you’ve mastered the basics, these advanced concepts can further improve results.
Multiple Timeframe Analysis
How It Works:
- Use higher timeframe 50 EMA for major trend
- Use lower timeframe 50 EMA for entries
Example:
- Daily chart: 50 EMA sloping up (major uptrend confirmed)
- 4-hour chart: Wait for pullback to 4H 50 EMA
- Entry on 4H with knowledge daily trend supports you
Benefits:
- Trade with major trend
- Better entry timing
- Higher confidence trades
50 EMA Angle Indicator
Concept: Measure the 50 EMA’s slope angle to quantify trend strength.
Guidelines:
- Angle > 30 degrees: Very strong trend—most aggressive trades
- Angle 15-30 degrees: Good trend—standard trades
- Angle 5-15 degrees: Weak trend—only A+ setups
- Angle < 5 degrees: No trend—avoid trading
How to Estimate:
- Steep visual slope = strong trend
- Gentle slope = weak trend
- Flat = no trend
Price Distance from 50 EMA
Concept: Best entries occur when price is 10-30 pips from 50 EMA during pullback, not 50+ pips.
Why:
- Too far (>40 pips): Pullback might be deeper than normal, trend weakening
- Just right (10-30 pips): Normal healthy pullback
- Too close (<10 pips): Might not be a pullback, just consolidation
50 EMA as Trailing Stop
How It Works:
- Enter trade using 50 EMA bounce/rejection
- As trade progresses, trail your stop loss below/above 50 EMA
- Exit when price closes on opposite side of 50 EMA
Benefits:
- Stays in strong trends longer
- Automatic exit signal
- Captures extended moves
Drawback:
- Gives back more profit than fixed targets
- Requires discipline to let it run
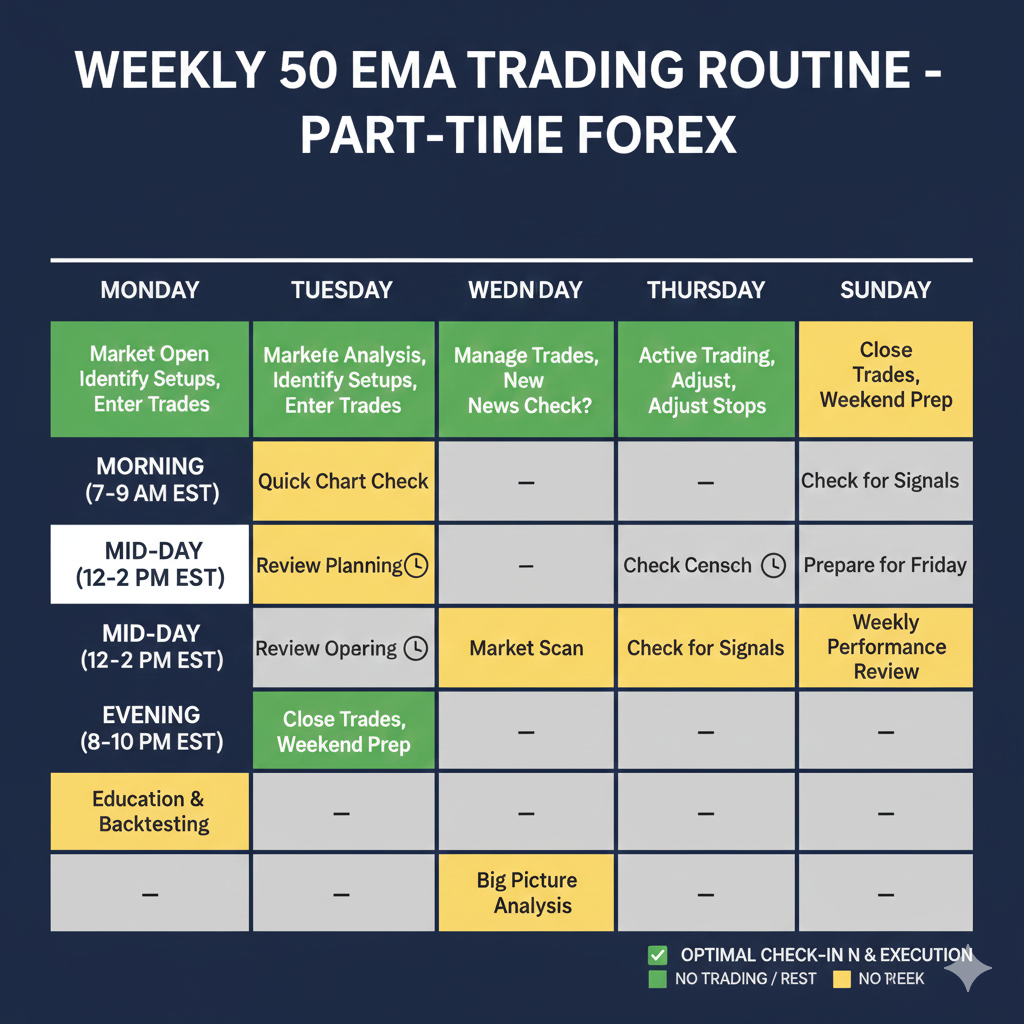
Weekly Trading Routine with 50 EMA
Here’s a realistic schedule for part-time traders.
Sunday Evening (Market Prep)
Time Commitment: 30-60 minutes
Tasks:
- Review all major pairs on daily charts
- Identify current trends (price position relative to 50 EMA)
- Mark any approaching 50 EMA levels
- Set alerts for price reaching 50 EMA ± 10 pips
- Note any major news events for the week
- Review last week’s trades in journal
Goal: Enter the week knowing which pairs to watch and where setups might develop.
Daily Quick Check (Monday-Friday)
Time Commitment: 10-15 minutes, twice daily
Morning Check (Before Work):
- Scan watchlist for any overnight 50 EMA touches
- Check if any alerts triggered
- Review any open positions
- Adjust stops if needed (move to break-even if in profit)
Evening Check (After Work):
- Full scan of all watchlist pairs
- Look for new 50 EMA setup developments
- Place pending orders if clear setups exist
- Review and adjust existing trades
When Setup Appears
Time Commitment: 5-10 minutes
Actions:
- Verify all entry conditions met
- Calculate position size based on stop distance
- Place trade with stops and targets
- Set alerts for target levels
- Log trade in journal
- Walk away—let trade work
Weekend Review
Time Commitment: 30-45 minutes
Saturday Tasks:
- Close any remaining open trades
- Complete full journal entries for week’s trades
- Calculate weekly statistics
- Identify patterns in wins/losses
- Plan improvements for next week
- Mental reset and preparation
Weekly Goals:
- Take 2-5 quality setups per week
- Maintain 60%+ win rate
- Achieve 3-6% account growth monthly
- Continuous learning and improvement
50 EMA Strategy Performance Expectations
Realistic Targets by Experience Level
Beginner (Months 1-3):
- Win rate: 55-60%
- Average winner: 40-60 pips
- Average loser: 25-35 pips
- Trades per month: 5-10
- Monthly return: 2-4%
Intermediate (Months 4-9):
- Win rate: 60-65%
- Average winner: 50-80 pips
- Average loser: 20-30 pips
- Trades per month: 10-15
- Monthly return: 4-7%
Advanced (Months 10+):
- Win rate: 65-70%
- Average winner: 60-100 pips
- Average loser: 15-25 pips
- Trades per month: 15-20
- Monthly return: 6-10%
Important Notes:
- These are averages—some months will be better, some worse
- Consistency matters more than spectacular individual returns
- Focus on process, not immediate profits
- Protect capital above all else
What Affects Your Results
Positive Factors:
- Trading higher timeframes (daily > 4H > 1H)
- Waiting for A+ setups with all confirmations
- Strict risk management (1-2% per trade)
- Trading during high liquidity sessions
- Focusing on 2-3 pairs maximum
- Keeping detailed journal and reviewing it
Negative Factors:
- Overtrading (taking marginal setups)
- Trading during low liquidity or major news
- Ignoring confirmations due to impatience
- Poor risk management (>3% per trade)
- Jumping between timeframes
- Emotional trading after losses
[LINK PLACEHOLDER: Internal link to “How to Keep a Forex Trading Journal That Improves Results”]
Frequently Asked Questions
Can the 50 EMA strategy work on any currency pair?
Yes, the 50 EMA strategy works on all major and minor currency pairs because it’s based on trend-following principles that apply universally. However, it works best on liquid pairs with tight spreads (EUR/USD, GBP/USD, USD/JPY, AUD/USD) because these have cleaner trends and lower trading costs. Exotic pairs can work but require wider stops due to higher volatility.
How often does the 50 EMA strategy generate signals?
On daily charts, expect 1-3 quality setups per currency pair per month. On 4-hour charts, you’ll see 1-2 setups per week per pair. If you track 3-5 major pairs, you should find 2-5 good trades weekly on 4H charts, or 3-10 trades monthly on daily charts. Quality over quantity is key—don’t force trades.
What’s better: 50 EMA or 50 SMA?
The 50 EMA is generally better for active trading because it responds faster to price changes, making it more effective as dynamic support/resistance. The 50 SMA is slower and smoother, which some traders prefer for longer-term position trading. For the strategy outlined in this guide, stick with the 50 EMA for best results.
Should I use the 50 EMA for scalping?
No, the 50 EMA is not suitable for scalping (trades lasting minutes). Scalping requires faster indicators and thrives on noise, while the 50 EMA is designed to filter out noise and identify medium-term trends. The 50 EMA works best for swing trading (days) and day trading (hours), not scalping (minutes).
Can I combine 50 EMA with other moving averages?
Yes, combining the 50 EMA with the 200 EMA is highly effective. The 200 EMA identifies the major trend, while the 50 EMA provides entry signals. Only take long trades when 50 EMA is above 200 EMA, and shorts when below. This combination significantly improves win rates by keeping you on the right side of major trends.
How do I know if the trend is strong enough to trade?
Check three things: (1) The 50 EMA must have a clear upward or downward slope—not flat, (2) Price should be consistently staying on one side of the 50 EMA with clean bounces/rejections, (3) Previous bounces off the 50 EMA should have resulted in continuation moves. If the trend doesn’t meet these criteria, wait for clarity.
What’s the best stop loss distance for 50 EMA trades?
Stop loss distance depends on timeframe and volatility. For daily charts, use 30-50 pips; for 4-hour charts, use 20-40 pips; for 1-hour charts, use 15-30 pips. The key is placing stops based on the swing low/high of the pullback, not arbitrary distances. Never risk more than 2% of your account regardless of stop distance.
Conclusion: Mastering the 50 EMA Strategy
The 50 EMA strategy is proof that simple doesn’t mean ineffective. This single indicator, when used correctly with proper confirmation and risk management, can form the foundation of a consistently profitable trading approach. Professional traders have used variations of this strategy for decades because it works—it keeps you on the right side of trends and provides clear, objective entry and exit signals.
Key Takeaways:
✅ The 50 EMA identifies trend direction – Trade with the slope, not against it ✅ Pullbacks to 50 EMA are opportunities – Buy bounces in uptrends, sell rejections in downtrends ✅ Always wait for confirmation – A touch isn’t enough; need reversal candle ✅ Higher timeframes are more reliable – Daily and 4-hour charts produce best signals ✅ Risk management is non-negotiable – Never risk more than 2% per trade ✅ Keep it simple – 50 EMA alone works; additional indicators are optional enhancements ✅ Patience beats frequency – Quality setups, not quantity, drive profitability
Your Action Plan:
Week 1-2: Study Phase
- Add 50 EMA to your charts
- Review 6-12 months of historical price action
- Identify past valid setups
- Practice drawing entry/exit scenarios
- Study without trading
Week 3-4: Demo Trading
- Switch to demo account
- Take 10-15 practice trades
- Follow all rules exactly
- Track results in journal
- Build confidence in execution
Month 2: Small Live Positions
- Start with minimum position sizes
- Trade only daily chart setups
- Focus on process, not profits
- Risk 0.5-1% maximum per trade
- Prove consistency
Month 3+: Scale and Optimize
- Gradually increase to full position sizes (2% risk)
- Add 4-hour chart setups once daily chart mastered
- Refine which confirmations work best for you
- Build your track record
- Consider adding second or third currency pair
Critical Reminders:
⚠️ Trend slope is everything – Flat 50 EMA = no trading ⚠️ Wait for the touch – Don’t predict, react ⚠️ Confirmation is mandatory – No reversal candle = no entry ⚠️ Stop losses are sacred – Never move wider, never remove ⚠️ Fewer trades = better quality – Selectivity beats activity ⚠️ Journal everything – Track, analyze, improve continuously
The 50 EMA strategy won’t make you rich overnight—no legitimate strategy will. But it will give you a systematic, repeatable approach to trading that, when combined with discipline and proper risk management, can generate consistent returns over time. The traders who succeed with this strategy are those who respect its simplicity, follow the rules religiously, and remain patient during inevitable losing streaks.
Start your 50 EMA journey today. Add the indicator to your charts, identify the current trends, and wait for your first quality setup. When it appears and meets all conditions, execute with confidence. Your systematic approach to trend trading begins with this single, powerful line on your chart.