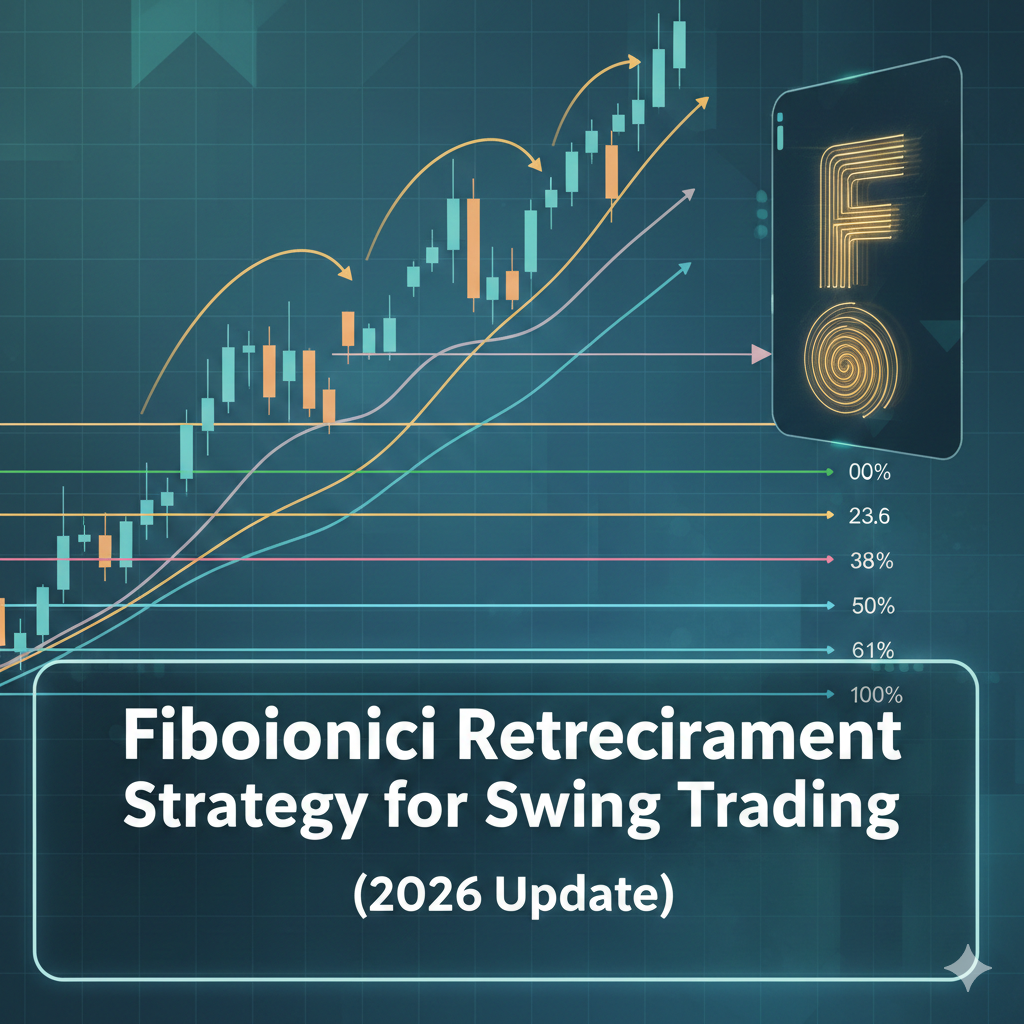
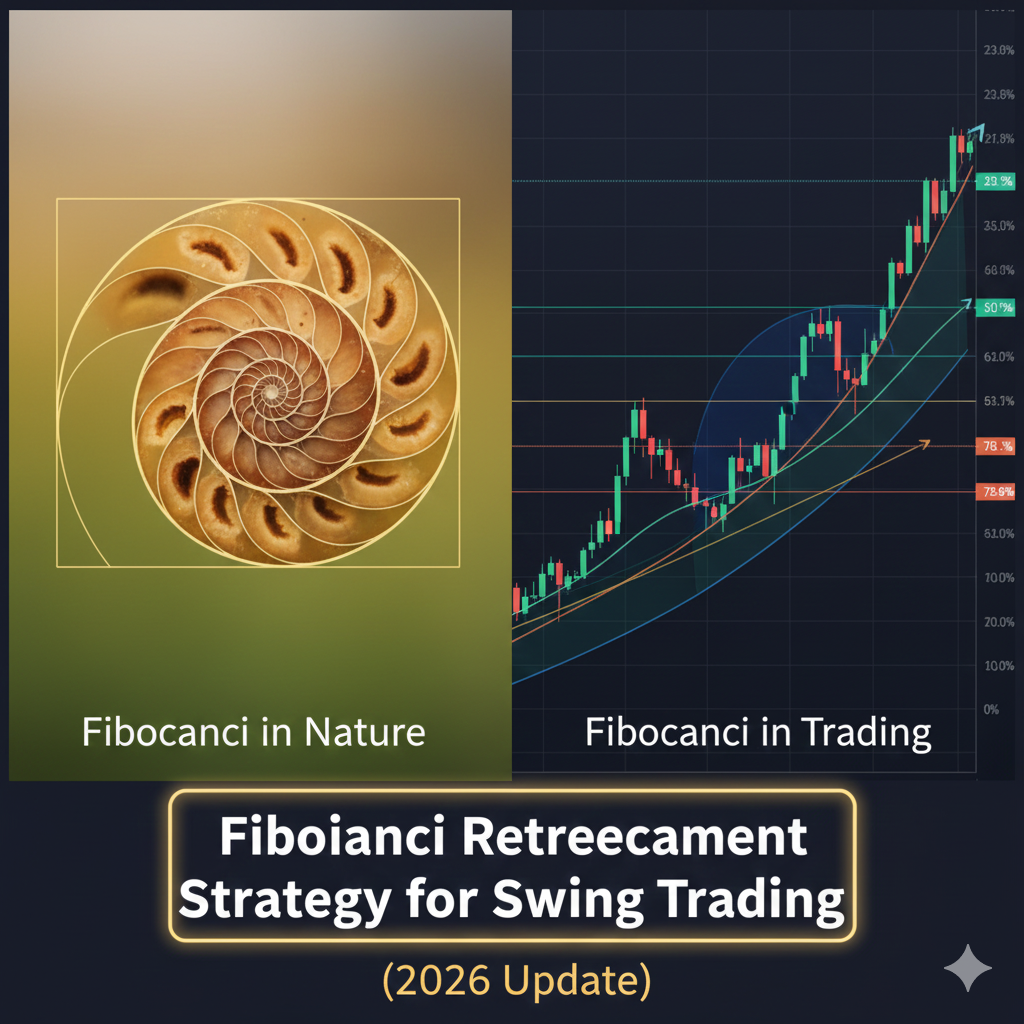
Fibonacci Retracement Strategy for Swing Trading (2026 Update)
Fibonacci retracement is one of the most powerful yet misunderstood tools in technical analysis. When used correctly, it helps you identify precise entry points during pullbacks in trending markets—exactly what swing traders need. The beauty of Fibonacci levels is that they work across all currency pairs and timeframes because they’re based on mathematical relationships that appear throughout nature and financial markets.
In this comprehensive 2026 guide, you’ll learn everything about using Fibonacci retracements for swing trading. You’ll discover how to draw them correctly, which levels matter most, how to combine them with other analysis, and complete trading strategies with exact entry and exit rules. By the end, you’ll understand why professional traders rely on Fibonacci levels and how to use them profitably.
What is Fibonacci Retracement?
Fibonacci retracement is a technical analysis tool that uses horizontal lines to indicate where potential support and resistance levels are likely to occur. These levels are based on the Fibonacci sequence, a mathematical pattern discovered by Italian mathematician Leonardo Fibonacci in the 13th century.
The Fibonacci Sequence
The sequence begins: 0, 1, 1, 2, 3, 5, 8, 13, 21, 34, 55, 89, 144…
The Pattern: Each number is the sum of the two preceding numbers:
- 0 + 1 = 1
- 1 + 1 = 2
- 1 + 2 = 3
- 2 + 3 = 5
- 3 + 5 = 8
- And so on…
The Ratio: When you divide any number by the next number, you get approximately 0.618 (after the first few numbers). This is called the “Golden Ratio” and appears throughout nature—flower petals, spiral galaxies, human body proportions, and yes, financial markets.
The Key Fibonacci Levels
In trading, we use these primary retracement levels:
23.6% – Shallow retracement (minor pullback) 38.2% – Moderate retracement (common in strong trends) 50.0% – Psychological midpoint (not technically Fibonacci but widely used) 61.8% – The “Golden Ratio” (most important level) 78.6% – Deep retracement (square root of 0.618)
Extension levels also exist (127.2%, 161.8%, 200%, 261.8%) but we’ll focus on retracements for swing trading.
Why Fibonacci Works in Trading
Mathematical harmony:
- Markets move in waves (impulse and correction)
- Corrections often retrace to Fibonacci proportions
- Self-fulfilling prophecy—traders watch these levels
Psychological factors:
- Traders naturally want to “buy the dip” or “sell the rally”
- Fibonacci levels provide mathematical structure to where dips/rallies typically end
- Institutional traders use them, creating support/resistance
Market structure:
- Reflects natural rhythm of buying and selling pressure
- Shows where profit-taking typically occurs
- Identifies where new positions are likely to enter
How to Draw Fibonacci Retracement Correctly
Drawing Fibonacci retracements properly is crucial. Incorrect placement leads to false signals and losses.
Step-by-Step Drawing Process
Step 1: Identify the Trend
- Look for clear uptrend (higher highs and higher lows)
- Or clear downtrend (lower highs and lower lows)
- Need obvious impulse move to measure
Step 2: Locate Swing High and Swing Low
For Uptrend (anticipating bullish continuation):
- Find the significant swing low (starting point)
- Find the recent swing high (ending point)
- Draw from low TO high
For Downtrend (anticipating bearish continuation):
- Find the significant swing high (starting point)
- Find the recent swing low (ending point)
- Draw from high TO low
Step 3: Apply the Fibonacci Tool
- Select Fibonacci retracement tool in your platform
- Click on starting point
- Drag to ending point
- Release
Step 4: Verify the Levels Your platform should automatically display:
- 23.6% level
- 38.2% level
- 50.0% level
- 61.8% level
- 78.6% level (if available)
Step 5: Wait for Price to Pull Back
- Don’t trade immediately
- Wait for price to retrace toward Fibonacci levels
- Look for confluence with other factors
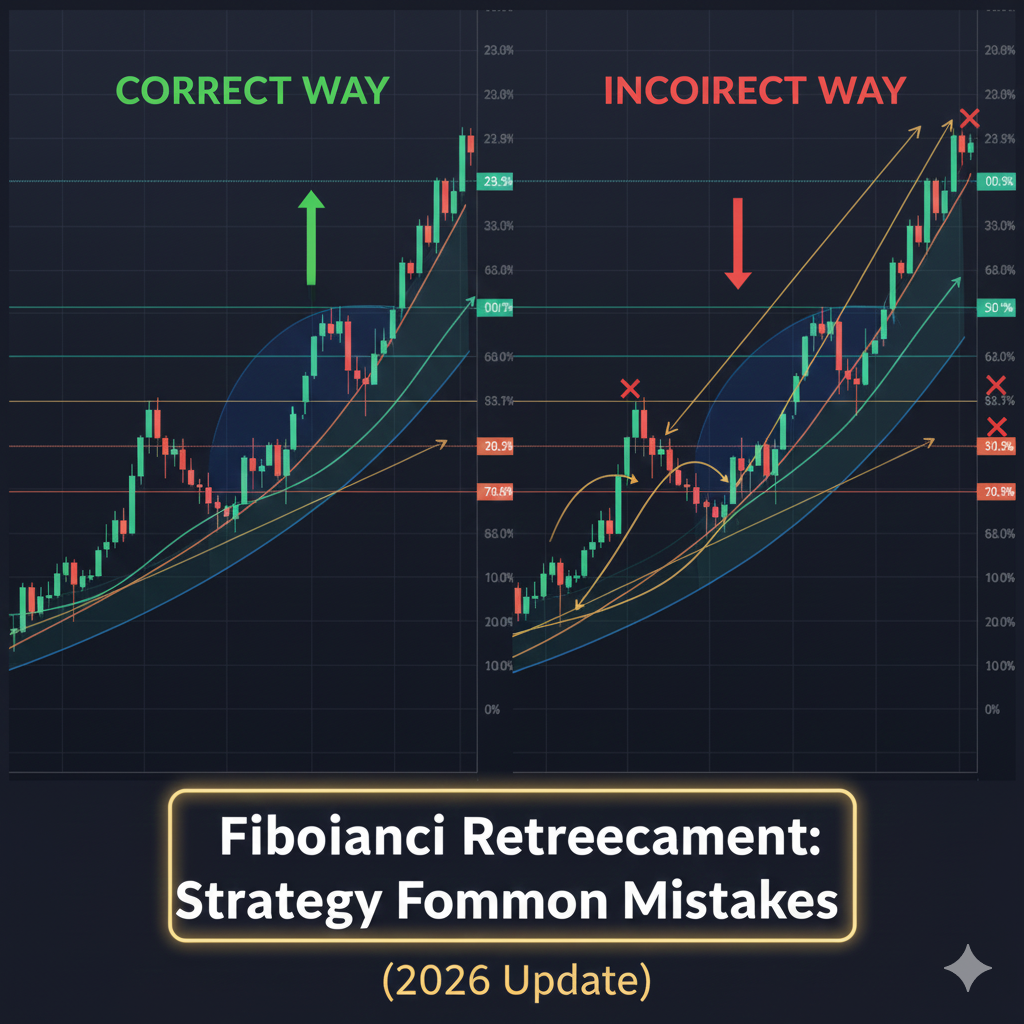
Common Drawing Mistakes
Mistake 1: Wrong Starting/Ending Points
- Don’t use minor swings—use significant moves only
- Need clear, obvious swing highs and lows
- If you’re debating which swing to use, the move probably isn’t clear enough
Mistake 2: Drawing Against the Trend
- Drawing down-to-up in a downtrend (wrong!)
- Drawing up-to-down in an uptrend (wrong!)
- Always draw in the direction you anticipate continuation
Mistake 3: Using Every Tiny Swing
- Fibonacci works best on significant moves
- Daily and 4-hour charts preferred
- Avoid 15-minute chart Fibonacci (too much noise)
Mistake 4: Not Updating as Market Evolves
- Price makes new highs/lows, you need to redraw
- Fibonacci is dynamic, not static
- Update your levels as market structure changes
Wick vs Body Debate
Should you draw to wicks or candle bodies?
Wick Approach (More Precise):
- Use absolute highest high and lowest low
- More accurate mathematically
- Preferred by purists
Body Approach (More Conservative):
- Use candle close prices
- Accounts for false spikes/wicks
- Creates zones rather than exact lines
Recommendation: Try both and see which produces better results for you. Most professional traders use wicks but think of Fibonacci as zones (±5-10 pips) rather than exact lines.
The Most Important Fibonacci Levels for Swing Trading
Not all Fibonacci levels are created equal. Some are more reliable than others.
61.8% – The Golden Ratio (Most Important)
Why It’s Special:
- The mathematical heart of Fibonacci
- Most commonly respected retracement
- Institutions watch this level closely
- Strongest bounce/rejection typically occurs here
Trading Application:
- Primary entry zone for swing trades
- Often marks the last chance to enter trend
- Deeper than this suggests trend weakness
Success Rate: 65-70% when combined with confluence
50.0% – The Psychological Level (Very Important)
Why It Works:
- Not technically a Fibonacci number but psychologically significant
- Represents “halfway back”
- Traders naturally think in halves
- Strong support/resistance at this level
Trading Application:
- First target for entries in strong trends
- If it holds, trend is very strong
- If it breaks, watch for 61.8%
Success Rate: 60-65% in strong trends
38.2% – The Shallow Retracement (Moderate Importance)
Why It Matters:
- Marks shallow pullbacks in very strong trends
- First Fibonacci level price typically encounters
- If holds here, trend momentum is extremely strong
Trading Application:
- Aggressive entries in powerful trends
- Often “the early bird” entry
- Risk of re-test of deeper levels
Success Rate: 55-60% (works best in trending markets)
23.6% – The Weak Level (Least Important)
Why It’s Less Reliable:
- Very shallow retracement
- Often just a pause, not true pullback
- Easily broken in normal market conditions
Trading Application:
- Generally skip this level
- Only consider in exceptionally strong trends
- Not recommended for swing trading entries
Success Rate: 45-50% (not recommended as primary entry)
78.6% – The Deep Level (Warning Sign)
Why It’s Different:
- Very deep retracement (square root of 0.618)
- Often last chance before trend invalidation
- Suggests trend losing steam
Trading Application:
- Only take if strong confluence exists
- Tighter stops required (trend might be reversing)
- Consider it a “last stand” level
Success Rate: 50-55% (higher risk)
Priority Order for Swing Trading:
- 61.8% (primary)
- 50.0% (secondary)
- 38.2% (aggressive/strong trends)
- 78.6% (defensive/weak trends)
- 23.6% (generally avoid)
[LINK PLACEHOLDER: Internal link to “Support and Resistance: Complete Trading Guide”]
Complete Fibonacci Swing Trading Strategy
Now let’s put it all together into actionable trading strategies.
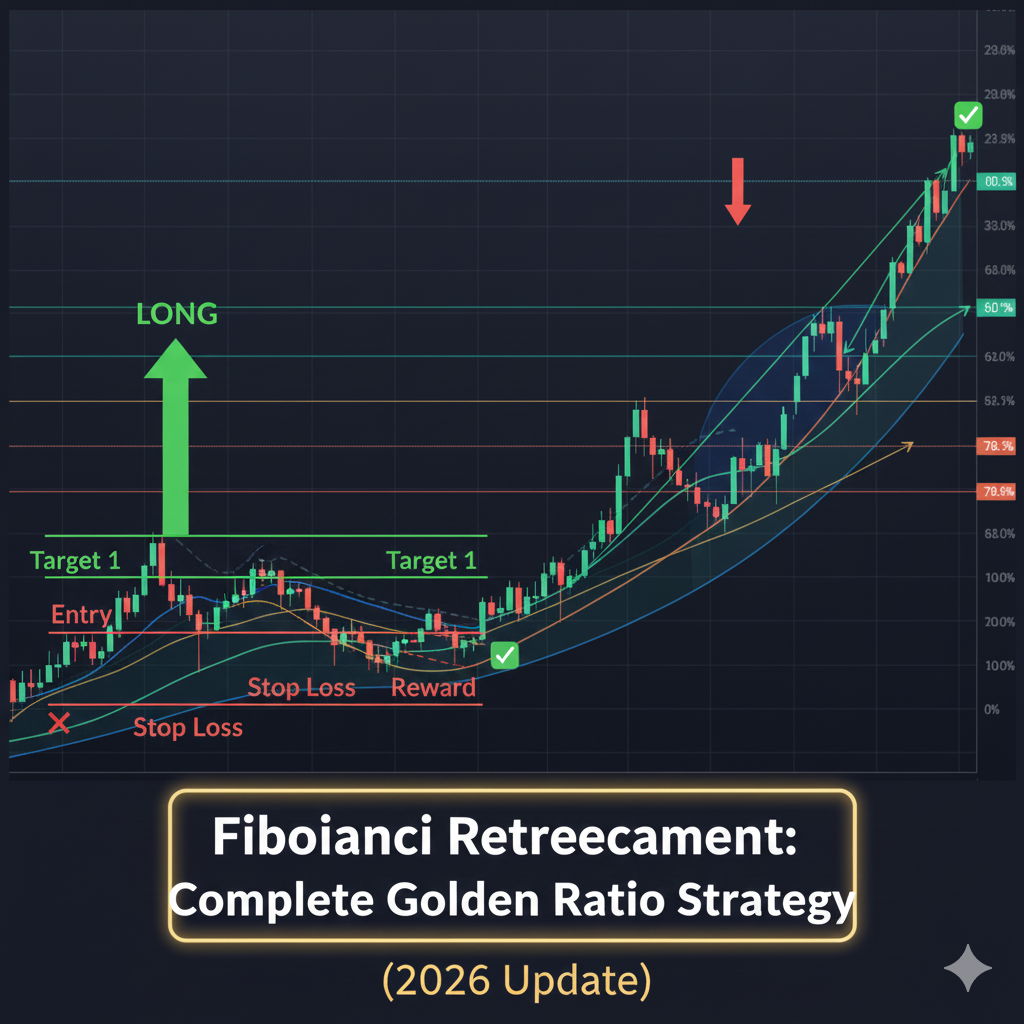
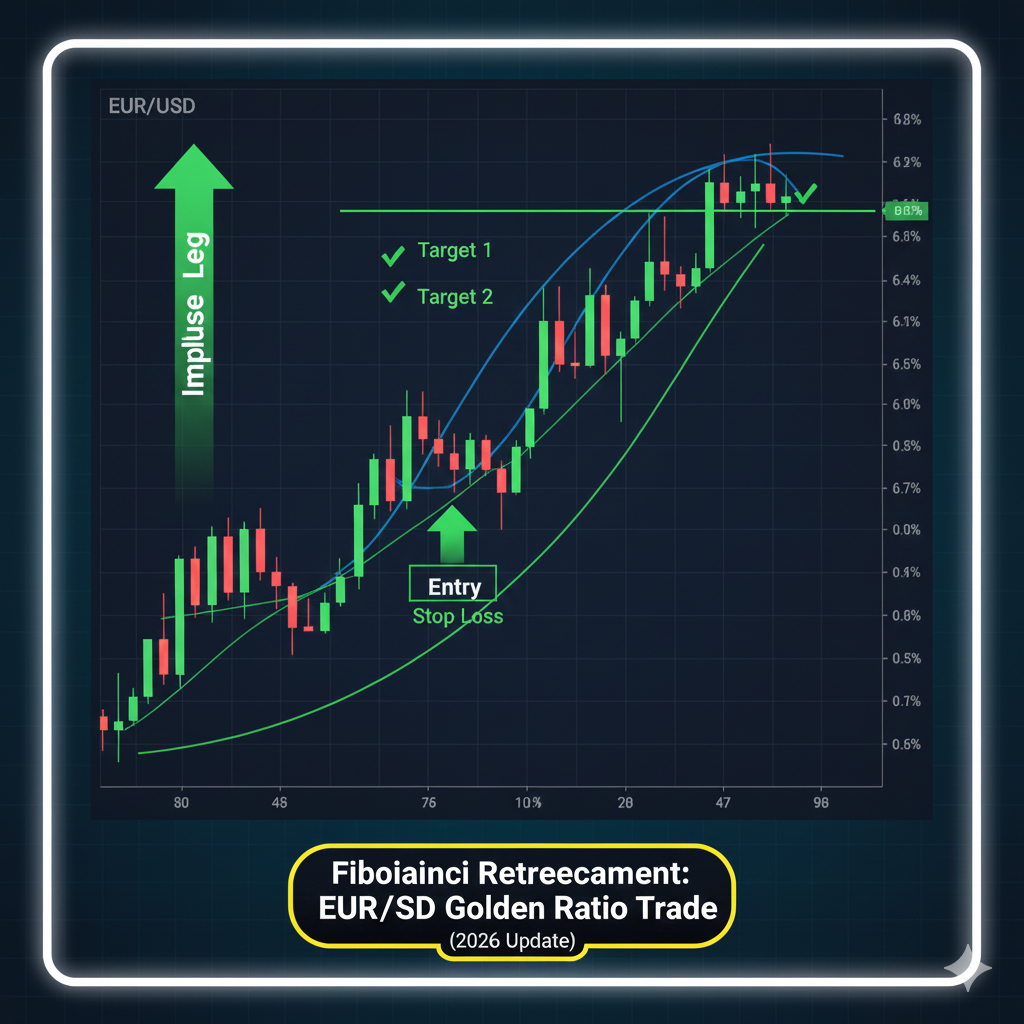
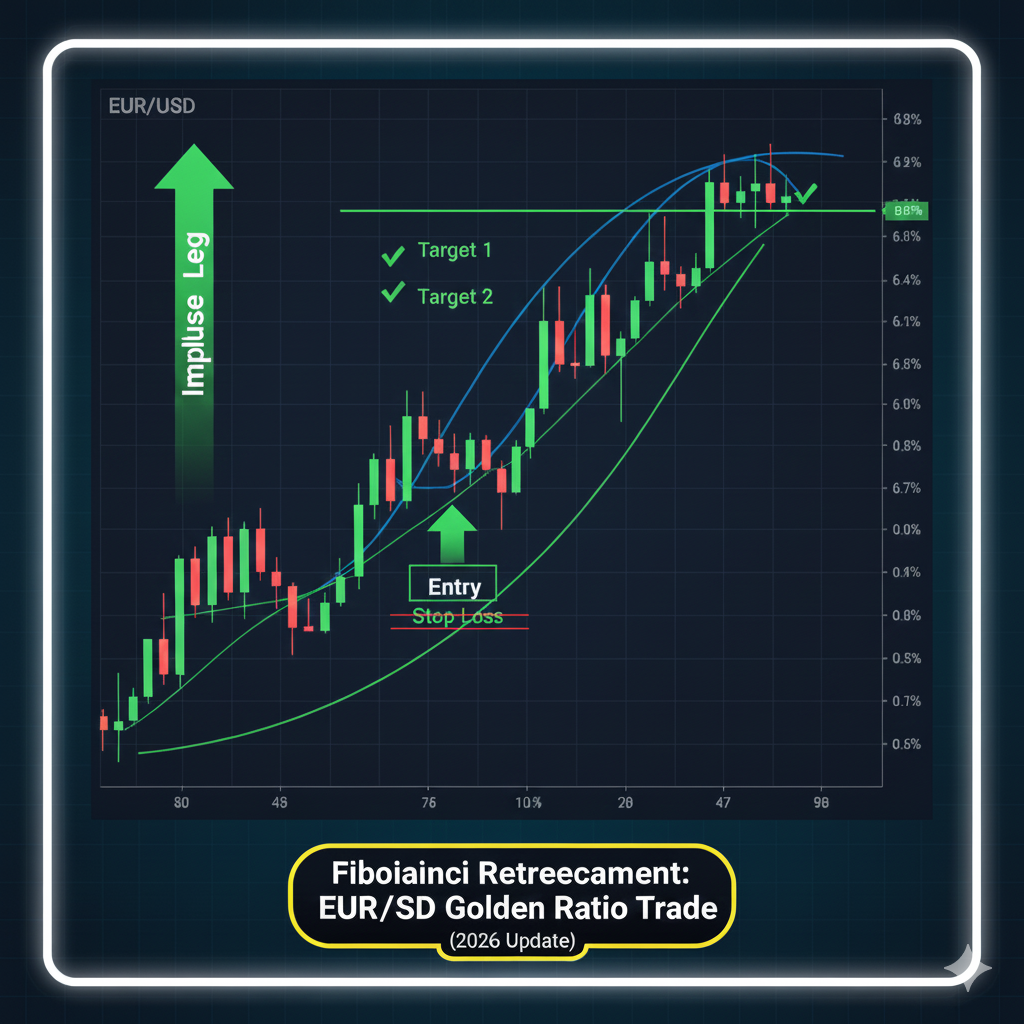
Strategy 1: The 61.8% Golden Zone Entry
Setup Requirements:
1. Identify Strong Trend
- Clear impulse move in one direction
- Higher highs/lows (uptrend) or lower highs/lows (downtrend)
- Trend confirmed on daily or 4-hour chart
- At least 100-150 pips of movement to measure
2. Draw Fibonacci Correctly
- Uptrend: Low to high
- Downtrend: High to low
- Use significant swing points only
- All levels clearly visible
3. Wait for Retracement
- Price pulls back toward Fibonacci levels
- Don’t predict—let it happen
- Watch for approach to 61.8% level
4. Confluence Confirmation (At Least 2 Required):
- Previous support/resistance at 61.8% level
- Round number nearby (00, 50 levels)
- Trendline support/resistance at level
- 50 or 200 EMA nearby
- RSI showing oversold/overbought
- Candlestick reversal pattern at level
Entry Rules:
Bullish Setup (Uptrend Continuation):
- Price retraces to 61.8% level
- Forms bullish reversal candle (pin bar, engulfing, hammer)
- Bounces from 61.8% with strong bullish candle
- Entry: 2-3 pips above reversal candle high
- Or: Next candle open if clearly bullish
Bearish Setup (Downtrend Continuation):
- Price rallies to 61.8% level
- Forms bearish reversal candle (shooting star, engulfing)
- Rejects from 61.8% with strong bearish candle
- Entry: 2-3 pips below reversal candle low
- Or: Next candle open if clearly bearish
Stop Loss Placement:
- Conservative: 10-20 pips beyond 78.6% level
- Moderate: 10-15 pips beyond 61.8% entry candle
- Aggressive: Just beyond entry candle extreme
- Maximum: 2% account risk
Take Profit Targets:
- Target 1: Previous swing high/low (50% position close)
- Target 2: 127.2% Fibonacci extension (50% position close)
- Or: 2:1 minimum, 3:1 preferred risk-reward
Trade Management:
- Move stop to break-even at 1:1 risk-reward
- Trail stop as new swing points form
- Exit if price closes beyond 78.6% (trend invalidated)
Strategy 2: The 50% Quick Bounce (Strong Trends)
Setup Requirements:
1. Very Strong Trend Confirmed
- Recent impulse move of 150+ pips
- No significant retracements yet
- Clear momentum in one direction
- Volume increasing on trend moves (if available)
2. Shallow Pullback Expected
- Strong trends often retrace only to 50%
- First pullback after major move
- Market sentiment still clearly one-directional
3. Multiple Timeframe Alignment
- Daily trend direction
- 4-hour showing same trend
- 1-hour pullback forming
Entry Rules:
Bullish Entry:
- Price pulls back to 50% Fibonacci level
- Shows immediate bounce (1-2 candles max)
- Strong bullish rejection candle
- Entry: Above bounce candle high
Bearish Entry:
- Price rallies to 50% Fibonacci level
- Shows immediate rejection (1-2 candles max)
- Strong bearish rejection candle
- Entry: Below rejection candle low
Stop Loss:
- Place just beyond 61.8% level
- This is tighter stop than Strategy 1
- If 50% fails, 61.8% is next target anyway
- Typically 30-40 pips for major pairs
Take Profit:
- Target 1: 100% extension (previous high/low) – 50% close
- Target 2: 127.2% extension – 50% close
- Quick moves expected in strong trends
Why This Works:
- Strong trends don’t retrace deeply
- 50% represents “buying the dip” in momentum
- Early entry captures more of the move
- Higher risk but excellent reward in trending markets
Best Conditions:
- Major trend breakout recently occurred
- News-driven moves
- During high liquidity sessions
- First pullback after 200+ pip move
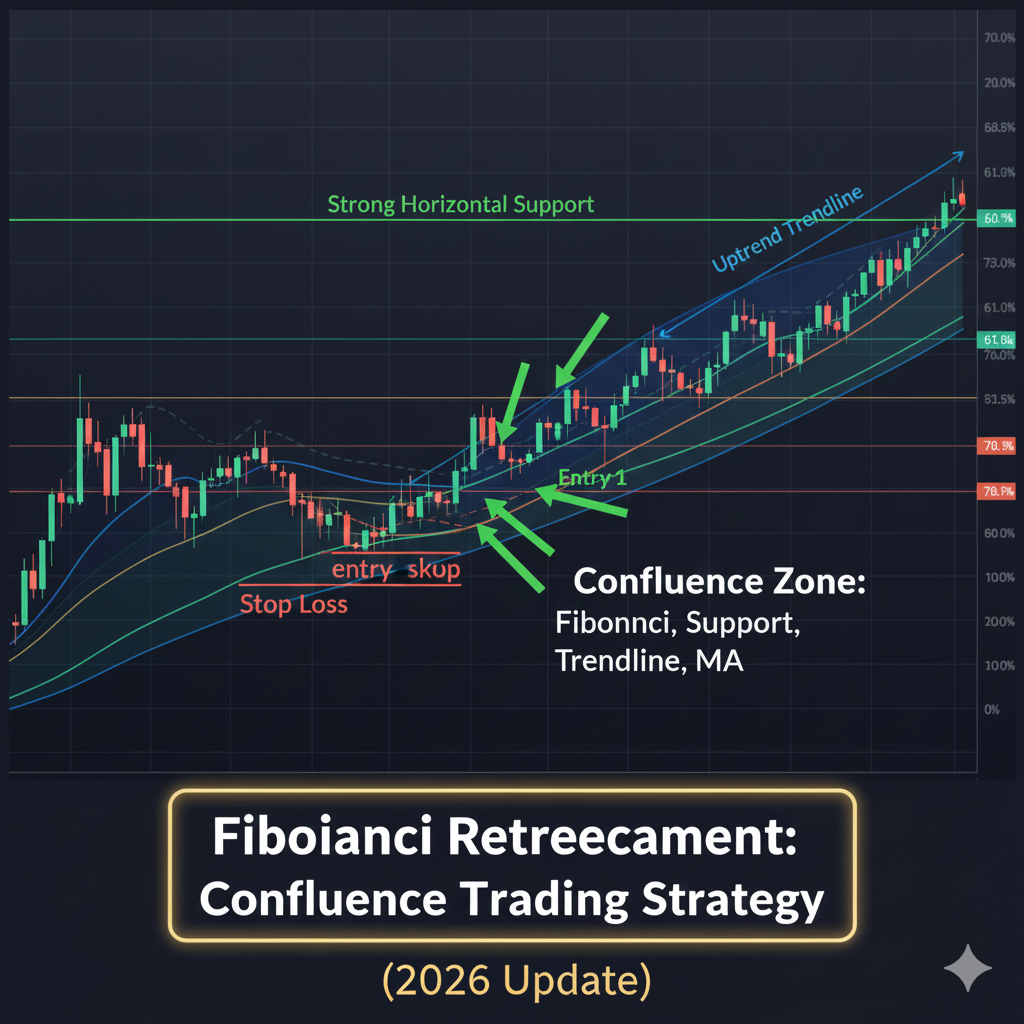
Strategy 3: The Confluence Power Play
This is the highest probability setup—combining multiple factors.
Setup Requirements:
1. Fibonacci Level at Key Zone
- 61.8% or 50% Fibonacci level
- Must align with at least 3 of these:
- Previous swing high/low
- Major support/resistance
- Psychological round number (00, 50)
- Trendline touch
- Moving average (50 or 200 EMA)
- Previous day/week high/low
2. Multiple Timeframe Agreement
- Daily chart: Trend direction clear
- 4-hour: Fibonacci level marked
- 1-hour: Entry setup forming
3. Technical Confirmation
- RSI showing divergence or reversal
- MACD turning in favor direction
- Volume spike on bounce/rejection
- Price action pattern (pin bar, engulfing)
4. Fundamental Alignment (Optional)
- Trading with carry trade direction
- No major opposing news expected
- Risk-on/risk-off sentiment aligned
Entry Rules:
When 3+ confluence factors align at Fibonacci level:
- Wait for strong reversal candle
- Entry more aggressive (on candle close)
- Higher confidence = can increase position slightly (still max 2% risk)
Stop Loss:
- Can be tighter due to confluence (less likely to fail)
- 10-15 pips beyond entry candle
- Or just beyond next Fibonacci level
Take Profit:
- Can target further due to high probability
- Target 1: Previous extreme (40% close)
- Target 2: 127.2% extension (40% close)
- Target 3: Trail remaining 20% with price
Expected Win Rate: 70-75% (highest probability setup)
Strategy 4: The Failed Fibonacci (Counter Setup)
When Fibonacci levels fail, they often produce strong counter-trend moves.
Setup Requirements:
1. Clear Fibonacci Level
- 61.8% or 50% level identified
- Price approaches level as expected
2. Level Breaks Instead of Holds
- Price breaks through Fibonacci level decisively
- Closes beyond level (not just wick penetration)
- Usually breaks with momentum candle
3. What This Means
- Original trend losing strength
- Potential reversal occurring
- Traders positioned wrong way getting stopped out
Entry Rules:
Failed Support (61.8% breaks down in uptrend):
- Entry: Short position 5-10 pips below 61.8% level after break
- Or: On re-test of 61.8% as new resistance
- This signals uptrend potentially reversing
Failed Resistance (61.8% breaks up in downtrend):
- Entry: Long position 5-10 pips above 61.8% level after break
- Or: On re-test of 61.8% as new support
- This signals downtrend potentially reversing
Stop Loss:
- Place 15-20 pips on opposite side of broken Fibonacci level
- Tight stop because if this fails, level still holds
Take Profit:
- Target: Next Fibonacci level (78.6%, then 100%, then beyond)
- Or: Previous swing in opposite direction
- These moves can be large—trail stop aggressively
Why This Works:
- Stop losses clustered at Fibonacci levels
- Break triggers cascade of stops
- Trapped traders create momentum
- Counter-trend moves often violent and fast
Risk Warning: Counter-trend trading is riskier. Only take these with strong confirmation and tight stops.
[LINK PLACEHOLDER: Internal link to “How to Trade False Breakouts and Stop Hunts”]
Combining Fibonacci with Other Tools
Fibonacci works best when combined with complementary analysis.
Fibonacci + Support/Resistance
The Power of Overlap:
When a Fibonacci level coincides with a previous support/resistance zone, the probability of a bounce/rejection increases dramatically.
How to Apply:
- Mark major S/R levels on your chart first
- Draw Fibonacci retracement
- Look for where Fibonacci levels intersect S/R
- These intersections are “power zones”
Example:
- Previous swing low at 1.0850
- 61.8% Fibonacci level at 1.0845
- This 5-pip zone is extremely high probability support
Priority: This is the single best confluence—always look for it first.
Fibonacci + Moving Averages
Dynamic S/R Meets Mathematical Levels:
50 EMA + Fibonacci:
- When 50 EMA aligns with 61.8% level = excellent entry
- Shows both trend strength and retracement zone
- Very common in sustained trends
200 EMA + Fibonacci:
- 200 EMA is major support/resistance
- Alignment with Fibonacci level = institutional level
- Rare but extremely powerful when occurs
How to Use:
- Add 50 and 200 EMA to your Fibonacci chart
- Look for price pulling back to both MA and Fib level
- These dual-confluence setups have 70%+ win rate
[LINK PLACEHOLDER: Internal link to “50 EMA Trading Strategy: Simple Yet Powerful”]
Fibonacci + Trendlines
Angular and Horizontal Confluence:
How It Works:
- Draw trendline connecting swing lows (uptrend) or swing highs (downtrend)
- Draw Fibonacci retracement
- Look for where trendline intersects Fibonacci level
Why It’s Powerful:
- Trendline shows dynamic support/resistance
- Fibonacci shows static retracement zone
- Both together = very high probability
Common Occurrence:
- Often 61.8% Fibonacci aligns with trendline
- This creates “triple confluence” with S/R
- These are A+ setups
Fibonacci + Candlestick Patterns
Price Action Confirmation:
Best Combinations:
Pin Bar at 61.8%:
- Long wick rejecting Fibonacci level
- Small body
- Closes near opposite end
- Extremely reliable signal
Engulfing at 50%:
- Previous candle small
- Next candle engulfs it completely
- Shows strong momentum resumption
Doji at 38.2%:
- Shows indecision at shallow retracement
- Next candle direction determines trade
- Wait for confirmation
Entry Rule: Never enter on Fibonacci alone—always wait for price action confirmation at the level.
Fibonacci + RSI Divergence
Momentum Confirmation:
Bullish Setup:
- Price makes lower low
- RSI makes higher low (divergence)
- Price now at 61.8% Fibonacci support
- Strong reversal signal
Bearish Setup:
- Price makes higher high
- RSI makes lower high (divergence)
- Price now at 61.8% Fibonacci resistance
- Strong reversal signal
Why It Works:
- Divergence shows momentum shifting
- Fibonacci shows where reversal likely occurs
- Combined = timing and location
[LINK PLACEHOLDER: Internal link to “RSI Divergence Trading Strategy: How to Spot Reversals”]
Fibonacci + Volume (If Available)
Volume Confirms Reversals:
At Fibonacci Levels:
- High volume on bounce/rejection = legitimate move
- Low volume on touch = weak signal, likely to fail
- Volume spike confirms institutional interest
How to Use:
- If your broker provides volume, watch it
- Entry on Fibonacci level + volume spike + reversal candle
- Without volume confirmation, require stronger price action
Fibonacci Extensions for Profit Targets
Once you enter at a retracement, where do you exit?
Common Extension Levels
100% – The Starting Point:
- Price returns to where retracement began
- Minimum target for most swing trades
- Conservative but reliable
127.2% – First Extension:
- 27.2% beyond the starting point
- Common first target
- Good risk-reward from 61.8% entry
161.8% – The Golden Extension:
- Most important extension level
- Price often reaches here in trends
- Primary target for swing trades
200% – Double the Move:
- Twice the original impulse
- In very strong trends
- Aggressive target
How to Use Extensions
Method 1: Automatic Projection
- Draw your Fibonacci retracement
- Most platforms show extensions automatically beyond 100%
- Use 127.2% and 161.8% as primary targets
Method 2: Manual Drawing
- Use Fibonacci extension tool (separate from retracement)
- Click: Start of move → End of move → Retracement low/high
- Shows future projection levels
Target Selection:
From 61.8% Entry:
- Conservative target: 100% (original high/low)
- Moderate target: 127.2% extension
- Aggressive target: 161.8% extension
- Risk-reward: Typically 2:1 to 4:1
From 50% Entry:
- Conservative: 100%
- Moderate: 127.2%
- Aggressive: 161.8% or 200%
- Risk-reward: Typically 2.5:1 to 5:1
Partial Profit Strategy:
- Close 50% at 100% level
- Close 30% at 127.2% level
- Trail final 20% toward 161.8%
Real Trading Examples
Let’s see Fibonacci in action with complete trade breakdowns.
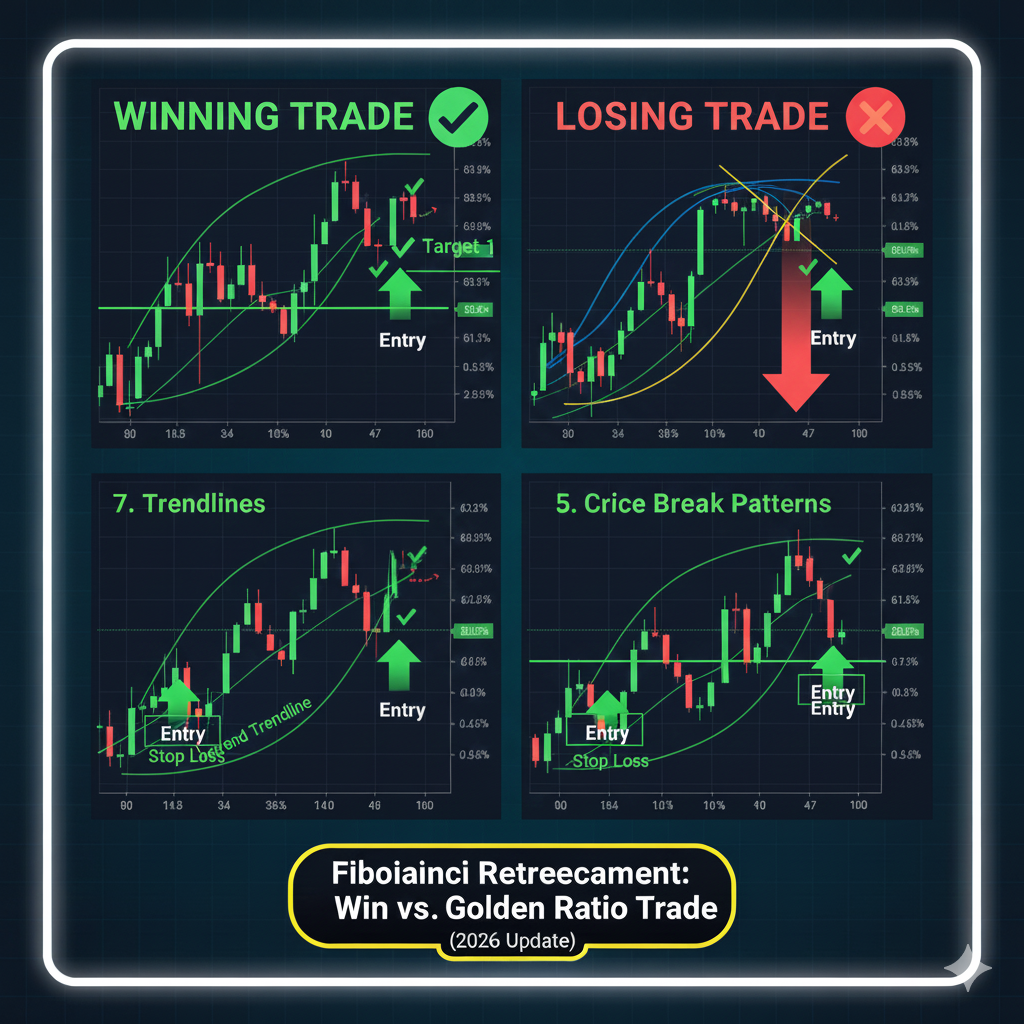
Example 1: EUR/USD Bullish 61.8% Setup (Winner)
Market Context:
- Pair: EUR/USD
- Timeframe: Daily Chart
- Date: November 2023
- Trend: Clear uptrend established
Setup Development:
Phase 1: Impulse Move
- October 25: Low at 1.0520
- November 8: High at 1.0850
- Total move: 330 pips upward
- Strong, clean impulse with no major retracements
Phase 2: Fibonacci Drawing
- Draw from 1.0520 (low) to 1.0850 (high)
- Key levels:
- 23.6%: 1.0772
- 38.2%: 1.0724
- 50.0%: 1.0685
- 61.8%: 1.0646
- 78.6%: 1.0579
Phase 3: Retracement
- November 9-14: Price pulls back
- Falls through 50% level
- Approaches 61.8% at 1.0646
Phase 4: Confluence Analysis
- 61.8% level at 1.0646
- Previous resistance at 1.0650 (now support)
- Round number 1.0650 nearby
- 50 EMA at 1.0640
- Four-factor confluence!
Phase 5: Entry Signal
- November 14: Price touches 1.0644 (2 pips below 61.8%)
- Forms bullish hammer with long lower wick
- Next candle: Strong bullish close at 1.0668
Trade Execution:
Entry: 1.0670 (next candle open) Stop Loss: 1.0620 (beyond 78.6% level) Risk: 50 pips
Targets:
- Target 1: 1.0850 (100% level) = 180 pips = 3.6:1 RR
- Target 2: 1.0935 (127.2% extension) = 265 pips = 5.3:1 RR
Trade Management:
November 15: Price reaches 1.0720 (+50 pips). Move stop to 1.0670 (breakeven).
November 17: Target 1 hit at 1.0850. Close 50% position for +180 pips profit.
November 21: Price continues to 1.0920, approaching Target 2.
November 22: Target 2 hit at 1.0935. Close remaining 50% for +265 pips profit.
Results:
- Average profit: (180 + 265) ÷ 2 = 222.5 pips
- Risk-reward achieved: 4.45:1
- Position held: 8 days
- Account gain: 4.45% (on 2% risk)
Key Success Factors:
- Four-factor confluence at 61.8%
- Clear uptrend context
- Perfect hammer reversal candle
- Patience letting winners run
- Daily timeframe provided clarity
Example 2: GBP/USD Bearish 50% Setup (Winner)
Market Context:
- Pair: GBP/USD
- Timeframe: 4-Hour Chart
- Date: December 2023
- Trend: Strong downtrend
Setup Development:
Phase 1: Impulse Drop
- December 5, 8:00 AM: High at 1.2740
- December 6, 4:00 PM: Low at 1.2540
- Total move: 200 pips downward
- Clean impulse, no hesitation
Phase 2: Fibonacci Drawing
- Draw from 1.2740 (high) to 1.2540 (low)
- Key levels:
- 23.6%: 1.2587
- 38.2%: 1.2616
- 50.0%: 1.2640
- 61.8%: 1.2664
- 78.6%: 1.2697
Phase 3: Rally to 50%
- December 6-7: Price bounces
- Rallies quickly toward Fibonacci levels
- Strong momentum toward 50%
Phase 4: Confluence
- 50% level at 1.2640
- Previous support at 1.2635 (now resistance)
- Downtrend line intersects at 1.2645
- Three-factor confluence
Phase 5: Rejection
- December 7, 8:00 PM: Price reaches 1.2642
- Forms bearish shooting star candle
- Long upper wick rejecting 50% level
- Next candle: Strong bearish close at 1.2625
Trade Execution:
Entry: 1.2622 (next candle open) Stop Loss: 1.2670 (just above 61.8%) Risk: 48 pips
Targets:
- Target 1: 1.2540 (100% level) = 82 pips = 1.7:1 RR
- Target 2: 1.2485 (127.2% extension) = 137 pips = 2.85:1 RR
Trade Management:
December 8, 4:00 AM: Price drops to 1.2580 (-42 pips). Move stop to 1.2622 (breakeven).
December 8, 4:00 PM: Target 1 hit at 1.2540. Close 50% for +82 pips.
December 9, 12:00 PM: Target 2 hit at 1.2485. Close remaining 50% for +137 pips.
Results:
- Average profit: (82 + 137) ÷ 2 = 109.5 pips
- Risk-reward: 2.28:1
- Position held: 2 days
- Account gain: 2.28% (on 2% risk)
Key Success Factors:
- Strong downtrend context
- 50% held in strong trend (typical)
- Clear shooting star rejection
- Triple confluence
- 4-hour timeframe good for swing trading
Example 3: USD/JPY Failed 61.8% (Loser)
Market Context:
- Pair: USD/JPY
- Timeframe: Daily Chart
- Date: January 2024
- Trend: Uptrend attempting
Setup Development:
Phase 1: Attempted Impulse
- January 10: Low at 145.20
- January 15: High at 148.80
- Move: 360 pips upward
- Appeared to be strong impulse
Phase 2: Fibonacci Drawing
- Draw from 145.20 to 148.80
- 61.8% level: 146.97
Phase 3: Retracement
- January 16-18: Price pulls back
- Approaches 61.8% level
- Looks like textbook setup
Phase 4: Entry (Mistake)
- January 18: Price touches 146.95
- Small bullish candle forms (not strong reversal)
- Entered anyway due to impatience
- Entry: 147.00
Trade Execution:
Entry: 147.00 Stop Loss: 146.50 (50 pips) Target: 148.80 (180 pips for 3.6:1 RR)
What Went Wrong:
January 19: Instead of bouncing, price continued lower through 61.8%.
January 20: Price broke 78.6% level and continued dropping.
January 21: Stop loss hit at 146.50.
Loss: -50 pips (-2% account)
Post-Analysis – Why It Failed:
1. Weak Confirmation:
- Entry candle was small, indecisive
- Should have waited for strong bullish reversal
- Entered on touch, not bounce
2. No Strong Confluence:
- 61.8% level stood alone
- No S/R at that level
- No MA confluence
- No trendline support
3. Context Issues:
- Original “impulse” was choppy on closer inspection
- Not a clean trend structure
- Should have been skeptical from start
4. Impatience:
- Forced the trade because “it should work”
- Ignored warning signs
- Confirmation bias
Key Lessons:
- Fibonacci alone isn’t enough—need confluence
- Wait for strong reversal candles
- Context and trend quality matter
- Losses happen—proper stop loss kept it manageable (only 2%)
- This is why we risk only 1-2% per trade
Important: This losing trade shows reality—even good setups fail. The 50-pip loss was easily recovered with next winning trade. Risk management works.
Best Timeframes for Fibonacci Swing Trading
Daily Chart – Most Reliable (Recommended)
Advantages:
- Clearest Fibonacci levels
- Strongest support/resistance
- Fewest false signals
- Best for swing trading (hold 3-10 days)
- Less screen time needed
Disadvantages:
- Fewer setups (2-4 per month per pair)
- Wider stop losses (50-80 pips typical)
- Requires patience
- Slower trade feedback
Best For: Swing traders, part-time traders, beginners
Expected Win Rate: 65-70% with proper confluence
4-Hour Chart – Active Swing Trading
Advantages:
- More frequent signals (1-2 per week per pair)
- Still reliable Fibonacci levels
- Good balance of activity and reliability
- Moderate stop losses (30-60 pips)
- Can check 4 times daily (manageable)
Disadvantages:
- More false signals than daily
- Requires more monitoring
- Can miss extended moves if too short-term focused
Best For: Active swing traders, serious part-time traders
Expected Win Rate: 60-65% with confluence
1-Hour Chart – Aggressive Swing/Day Trading
Advantages:
- Multiple signals daily
- Shorter holding periods (hours to 2 days)
- Tighter stops possible (20-40 pips)
- Quick feedback on trades
Disadvantages:
- More noise and false signals
- Requires frequent monitoring
- Lower reliability than higher timeframes
- Psychological pressure increases
Best For: Day traders, full-time traders
Expected Win Rate: 55-60% (requires excellent confluence)
15-Minute and Below – Not Recommended
Why Avoid:
- Excessive market noise
- Fibonacci levels less reliable
- False breakouts constant
- Spread costs more significant
- Very difficult to profit consistently
Exception: Can use higher timeframe Fibonacci levels on lower timeframes for entries only (use daily Fib levels, enter on 15-min chart with tight timing).
Recommendation: Start with daily charts. Once consistently profitable for 3+ months, experiment with 4-hour. Most successful Fibonacci traders never go below 4-hour charts.
[LINK PLACEHOLDER: Internal link to “Forex Trading Hours: Best Time to Trade Each Currency Pair”]
Common Fibonacci Mistakes and How to Avoid Them
Mistake #1: Drawing on Every Small Move
The Problem: Drawing Fibonacci on every 30-50 pip move, creating cluttered charts with meaningless levels.
Why It Fails: Fibonacci works on significant moves that represent true market swings. Minor fluctuations don’t create reliable retracement levels.
The Fix:
- Daily chart: Minimum 150+ pip moves
- 4-hour chart: Minimum 100+ pip moves
- 1-hour chart: Minimum 70+ pip moves
- If move isn’t obvious, don’t draw Fibonacci
Mistake #2: Trading Fibonacci Without Confluence
The Problem: “Price hit 61.8%, I’m entering!” without checking any other factors.
Why It Fails: Fibonacci alone has maybe 50-55% reliability. Need additional confirmation to reach 65-70%+ win rates.
The Fix:
- Require minimum 2 confluence factors
- Best: 3+ confluence factors
- S/R, trendlines, MAs, patterns, etc.
- No confluence = no trade
Mistake #3: Ignoring Price Action at Levels
The Problem: Entering immediately when price touches Fibonacci level without waiting for reversal confirmation.
Why It Fails: Price often penetrates levels before bouncing, or breaks through entirely. No confirmation = premature entries.
The Fix:
- Always wait for reversal candle
- Pin bar, engulfing, hammer, etc.
- Price action confirms the level is holding
- Entry on confirmation, not touch
Mistake #4: Using Wrong Swing Points
The Problem: Drawing from arbitrary highs/lows or using too recent/minor swings.
Why It Fails: Wrong starting/ending points create meaningless Fibonacci levels that have no predictive power.
The Fix:
- Use obvious, significant swings only
- If debating which swing, move is probably not clear enough
- Zoom out to see bigger picture
- Most recent significant swing high/low
Mistake #5: Not Updating Fibonacci Levels
The Problem: Drawing Fibonacci once and leaving it forever, even as market makes new highs/lows.
Why It Fails: Markets are dynamic. Old Fibonacci levels become irrelevant as new structure forms.
The Fix:
- Update when price makes new significant high/low
- Remove old Fibonacci that’s been invalidated
- Keep chart current with market structure
- Dynamic analysis for dynamic markets
Mistake #6: Over-Relying on 23.6% Level
The Problem: Taking every 23.6% retracement as a valid entry.
Why It Fails: 23.6% is too shallow, often just a pause before deeper retracement. Very low reliability.
The Fix:
- Focus on 50% and 61.8% primarily
- Skip 23.6% unless exceptional circumstances
- 38.2% only in very strong trends
- Stick to the reliable levels
Mistake #7: Forgetting About Extensions
The Problem: Entering at Fibonacci retracement but having no target beyond the swing high/low.
Why It Fails: Missing extended moves because no profit target set. Or holding too long without plan.
The Fix:
- Always plot extension levels (127.2%, 161.8%)
- Have clear profit targets before entry
- Use extensions for realistic targets
- Partial profits at logical levels

Fibonacci Trading Psychology
Patience is Critical
The Challenge: Fibonacci setups don’t appear every day. You might wait a week or more for the perfect setup.
The Psychology:
- Boredom leads to forcing trades
- Fear of missing out (FOMO) on moves
- Impatience creates bad entries
The Solution:
- Quality over quantity always
- Track your A+ setups vs B/C setups
- You’ll find A+ setups win 70%+, B/C setups win 50-55%
- Better to take 1 trade per week at 70% than 5 trades at 55%
- Patience IS the edge
Dealing with Failed Levels
The Reality: Even perfect Fibonacci setups fail 30-40% of the time. Levels break. Stops get hit.
The Psychology:
- Frustration after stops hit
- Questioning the entire method
- Revenge trading to “make it back”
The Solution:
- Losses are part of trading, not failures
- Fibonacci gives probability edge, not certainty
- Proper risk management means single loss is manageable
- Review losing trades for lessons, then move on
- Next setup is a fresh opportunity
Trusting the Levels
The Challenge: When price approaches 61.8% Fibonacci level, your mind says “It’s going to break through, this time is different.”
The Psychology:
- Fear prevents entry at best levels
- Every trade feels like “the one that will fail”
- Hesitation causes missed opportunities
The Solution:
- Trust the statistics: 65-70% win rate with confluence
- Follow your rules mechanically
- If all criteria met, take the trade
- Can’t predict which setups win—need to take all valid ones
- Over 20-30 trades, probabilities work out
Overtrading Fibonacci
The Challenge: Seeing Fibonacci levels everywhere, taking every possible setup.
The Psychology:
- Excitement about the method
- Want to stay active in markets
- Feel like missing opportunities
The Solution:
- Set strict criteria (must have 2+ confluence)
- Use checklist for every trade
- Track statistics: quality setups vs quantity
- Your trading journal will prove quality wins
- Less is genuinely more with Fibonacci
[LINK PLACEHOLDER: Internal link to “Forex Trading Psychology: Master Your Emotions”]
Position Sizing for Fibonacci Trades
The 2% Risk Rule
Never risk more than 2% of your account on any Fibonacci trade, regardless of confidence.
Why 2% Maximum:
- Even A+ setups fail 25-30% of the time
- String of 3-5 losses can happen
- 2% risk means you can survive 50 consecutive losses
- Capital preservation is paramount
Calculating Position Size
Formula: Position Size = (Account Balance × Risk %) ÷ Stop Loss (pips)
Example 1: Daily Chart Trade
- Account: $10,000
- Risk: 2% = $200
- Stop Loss: 50 pips (typical for 61.8% entry)
- Position Size: $200 ÷ 50 = $4 per pip = 0.4 lots (40,000 units)
Example 2: 4-Hour Chart Trade
- Account: $5,000
- Risk: 1.5% = $75
- Stop Loss: 35 pips
- Position Size: $75 ÷ 35 = $2.14 per pip = 0.21 lots (21,000 units)
Adjusting for Confidence
Some traders slightly adjust position size based on confluence:
Standard Setup (2 confluence factors):
- Risk: 1.5%
Strong Setup (3-4 confluence factors):
- Risk: 2%
Exceptional Setup (5+ confluence factors):
- Risk: 2% (never exceed this regardless of confidence)
Weak Setup (1 confluence factor):
- Risk: 1% or skip entirely
Important: Never exceed 2% risk per trade no matter how perfect the setup looks. The one time you risk 5% will be the time the trade fails.
Building Your Fibonacci Trading Plan
Weekly Routine
Sunday Evening (30 minutes):
- Scan all major pairs on daily charts
- Identify current trends
- Mark any significant swings
- Draw fresh Fibonacci levels
- Note approaching setups
- Check economic calendar for week
Daily Check (15 minutes, twice daily):
- Morning: Check for overnight moves to Fibonacci levels
- Evening: Update Fibonacci if new swings formed
- Look for reversal candles at key levels
- Set alerts for price approaching Fibonacci zones
- Review any open positions
When Setup Appears (10 minutes):
- Verify all entry criteria met
- Check confluence factors
- Calculate position size
- Place trade with stops and targets
- Set alerts for target levels
- Log trade in journal
- Walk away
Weekend Review (45 minutes):
- Review all week’s trades
- Update statistics (win rate, average RR, etc.)
- Identify what worked and what didn’t
- Note any pattern in losses
- Plan improvements for next week
- Mental reset
Monthly Performance Goals
Realistic Targets:
Beginner (Months 1-3):
- Trades: 4-8 per month
- Win rate: 55-60%
- Average RR: 2:1
- Monthly return: 3-6%
Intermediate (Months 4-9):
- Trades: 8-12 per month
- Win rate: 60-65%
- Average RR: 2.5:1
- Monthly return: 6-10%
Advanced (Months 10+):
- Trades: 10-15 per month
- Win rate: 65-70%
- Average RR: 3:1
- Monthly return: 10-15%
Remember: These are averages. Some months will be better, others worse. Focus on consistency over time.
[LINK PLACEHOLDER: Internal link to “How to Create a Forex Trading Plan That Actually Works”]
Frequently Asked Questions
Do professional traders actually use Fibonacci?
Yes, many professional traders and institutions use Fibonacci retracements. They’re widely used because they work—when price approaches these mathematically significant levels, many traders are watching, creating self-fulfilling support/resistance. However, professionals rarely use Fibonacci alone; they combine it with other analysis for confluence.
Which is more important: 50% or 61.8%?
The 61.8% Golden Ratio is mathematically more significant and often provides stronger reactions. However, in very strong trends, the 50% level frequently holds because price doesn’t retrace deeply. Trade both, but prioritize 61.8% for highest probability, especially when combined with other confluence factors.
Should I use Fibonacci on every trade?
No. Fibonacci works best on clear trending moves with obvious swing points. In ranging, choppy, or unclear markets, Fibonacci levels become less reliable. Only use Fibonacci when you have a significant, clean impulse move to measure. Quality over quantity applies to when you draw Fibonacci, not just when you trade.
How do I know if I’m drawing Fibonacci correctly?
Your Fibonacci is drawn correctly if: (1) The swing points are obvious and significant (150+ pips on daily charts), (2) The trend direction is clear before the pullback, (3) Multiple traders would likely choose the same swing points, (4) The retracement levels make sense with previous support/resistance. If you’re uncertain about your swing points, the move probably isn’t clear enough.
Can Fibonacci work for day trading?
Fibonacci can work for day trading on 1-hour or 4-hour charts, but it’s less reliable than on daily charts. Day traders often use daily chart Fibonacci levels for direction and entries, then manage trades on lower timeframes. Pure lower-timeframe Fibonacci (15-min) is challenging due to noise. Daily Fibonacci works best for swing trading.
What if price breaks through all Fibonacci levels?
If price breaks through 61.8% or 78.6% without bouncing, the original trend is likely over or weakening significantly. Exit any trend-following positions. The break often signals a reversal is occurring. You can then look for reversal setups, or wait for a new trend to establish and draw fresh Fibonacci levels.
How many currency pairs should I track for Fibonacci setups?
Focus on 3-5 major pairs (EUR/USD, GBP/USD, USD/JPY, AUD/USD, USD/CAD) when starting. This provides enough opportunities (2-4 quality setups per week) without overwhelming you. As you gain experience, you can expand to 7-8 pairs. More pairs don’t necessarily mean more profits—better execution on fewer pairs often produces better results.
Conclusion: Mastering Fibonacci for Swing Trading
Fibonacci retracement is not a magic indicator that predicts every move, but it’s a powerful tool that, when used correctly with proper confluence and risk management, provides a significant edge in swing trading. The mathematical relationships embedded in the Fibonacci sequence appear consistently in financial markets because they reflect natural rhythm of price movement—impulse waves followed by corrective retracements.
Key Principles to Remember:
✅ Quality over quantity – Wait for significant moves with clear swing points ✅ Confluence is king – Never trade Fibonacci levels alone; require 2-3 additional factors ✅ 61.8% and 50% are primary – Focus on these two levels for highest probability ✅ Price action confirms – Wait for reversal candles at levels before entering ✅ Higher timeframes more reliable – Daily and 4-hour charts produce best results ✅ Risk management non-negotiable – Maximum 2% risk per trade regardless of confidence ✅ Extensions guide exits – Use 127.2% and 161.8% for realistic profit targets ✅ Patience is the edge – Perfect setups are worth waiting for
Your Fibonacci Mastery Roadmap:
Month 1: Study Phase
- Study 50+ historical charts with clear trends
- Practice drawing Fibonacci on completed moves
- Identify where 61.8% and 50% held vs broke
- Analyze confluence factors at successful levels
- Zero live trading—pure observation
Month 2: Pattern Recognition
- Continue chart study with focus on confluence
- Note which combinations work best
- Mark S/R levels first, then Fibonacci
- Identify your favorite setups
- Still no trading—building expertise
Month 3: Demo Trading
- Open demo account
- Take 2-4 trades per week maximum
- Only A+ setups (3+ confluence factors)
- Screenshot every trade
- Detailed journal with lessons
- Focus on execution, ignore P&L
Months 4-6: Building Consistency
- Continue demo if not yet consistently profitable
- Should see 60%+ win rate emerging
- Refine which confluence combinations work for you
- Develop your personal criteria
- When profitable 3+ months, consider live
Months 7+: Live Trading
- Start with 1% risk (half normal)
- Take only highest-confidence setups
- Scale to 2% risk gradually
- Continue journaling religiously
- Monthly statistical reviews
- Continuous improvement mindset
Advanced Mastery (Year 2+):
- Experiment with multiple timeframe Fibonacci
- Explore Fibonacci extensions more deeply
- Combine with other advanced techniques
- Mentor other traders (teaching deepens learning)
- Refine into personalized system
Final Thoughts:
Fibonacci retracement gives you a framework for understanding where price is likely to pause or reverse during trends. It transforms random-looking pullbacks into predictable opportunities. But the true power comes not from the Fibonacci levels themselves, but from how you combine them with price action, support/resistance, and market context.
The traders who succeed with Fibonacci are those who treat it as one tool in a comprehensive trading approach—not a magic solution. They wait patiently for clear trends, draw Fibonacci on significant moves only, demand multiple confluence factors, wait for price action confirmation, and manage risk meticulously.
Start your Fibonacci journey today. Open your charts, find a clear completed trend, and practice drawing Fibonacci retracements. Study how price reacted at each level. Look for confluence with S/R zones. Build your pattern recognition. In six months, you’ll be spotting high-probability retracement setups that most traders miss.
The Golden Ratio has guided architecture, art, and nature for millennia. Now let it guide your trading entries in the forex market.