RSI Divergence Trading Strategy: How to Spot Reversals (With Examples) – 2026
RSI divergence is one of the most powerful yet underutilized trading signals in forex. While most traders use the RSI (Relative Strength Index) indicator to identify overbought and oversold conditions, professional traders know that divergence patterns often predict trend reversals with remarkable accuracy—sometimes days or weeks before the reversal becomes obvious to everyone else.
In this comprehensive guide, you’ll learn exactly what RSI divergence is, how to spot it on your charts, and most importantly, how to trade it profitably with a complete strategy including entry rules, stop losses, and profit targets. By the end, you’ll have the knowledge to identify high-probability reversal setups that other traders miss.
What is RSI Divergence?
RSI divergence occurs when the price action of a currency pair moves in the opposite direction of the RSI indicator. This disagreement between price and momentum is a powerful warning sign that the current trend is losing strength and a reversal may be imminent.
Think of it this way: imagine a runner who appears to be speeding up (price making higher highs) but whose heart rate is actually decreasing (RSI making lower highs). This tells you the runner is losing energy and will likely slow down or stop soon. That’s essentially what divergence reveals in the market.
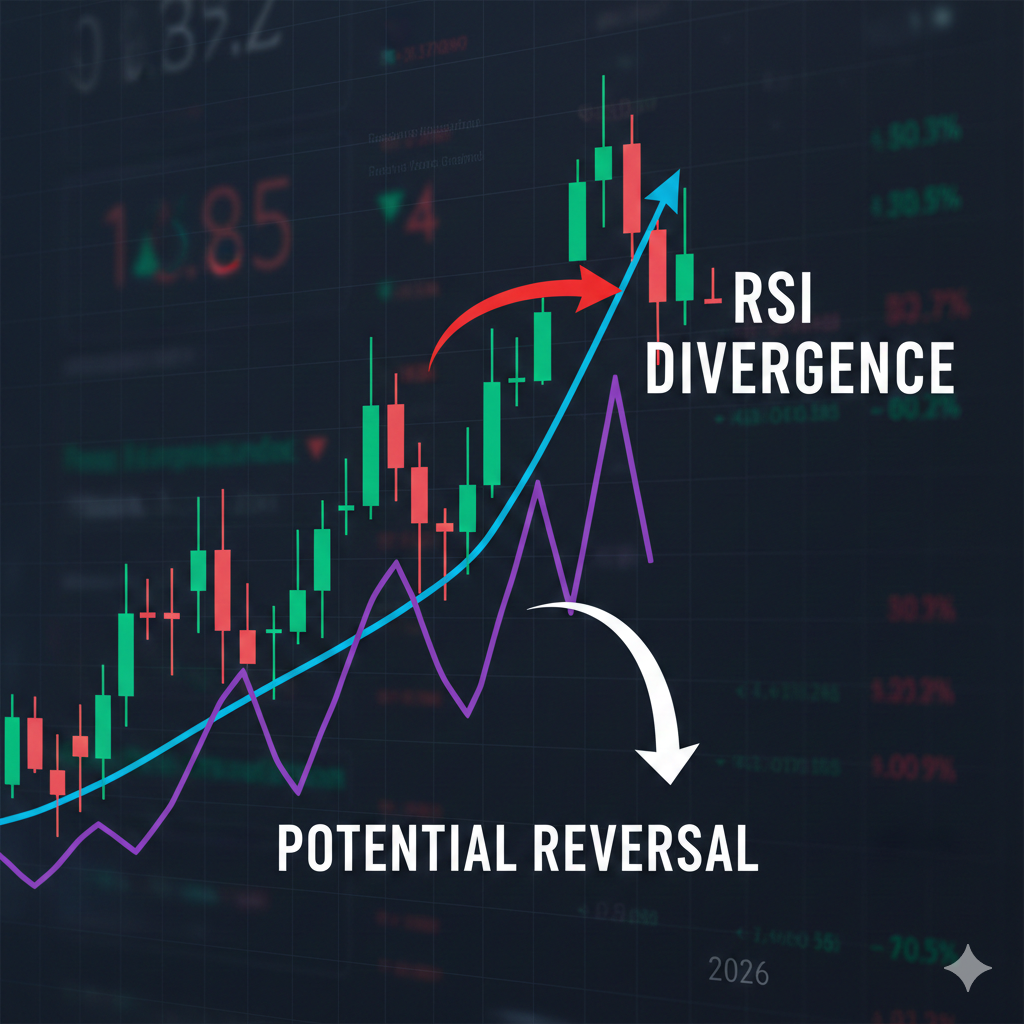
The Two Types of RSI Divergence
1. Bullish Divergence (Buy Signal)
- Price makes lower lows
- RSI makes higher lows
- Signals downtrend is weakening
- Potential reversal to the upside
2. Bearish Divergence (Sell Signal)
- Price makes higher highs
- RSI makes lower highs
- Signals uptrend is weakening
- Potential reversal to the downside
The beauty of divergence is that it alerts you to reversals BEFORE they’re obvious on the price chart, giving you an edge over traders who wait for confirmation.
Understanding the RSI Indicator
Before diving into divergence trading, you need to understand the RSI indicator itself.
What is RSI?
The Relative Strength Index (RSI) is a momentum oscillator that measures the speed and magnitude of price movements. It oscillates between 0 and 100 and was developed by J. Welles Wilder in 1978.
Standard Settings:
- Period: 14 (measures last 14 candles)
- Overbought level: 70
- Oversold level: 30
- Midpoint: 50
How RSI Works
RSI compares the magnitude of recent gains versus recent losses:
- RSI above 70 = Overbought (potential sell signal)
- RSI below 30 = Oversold (potential buy signal)
- RSI above 50 = Bullish momentum
- RSI below 50 = Bearish momentum
Traditional RSI vs. RSI Divergence
Traditional RSI Trading:
- Buy when RSI drops below 30 (oversold)
- Sell when RSI rises above 70 (overbought)
- Problem: Strong trends can stay overbought/oversold for extended periods
RSI Divergence Trading:
- Identifies when momentum is shifting BEFORE price reverses
- More reliable than simple overbought/oversold signals
- Works better in trending markets
- Provides earlier entry points
[LINK PLACEHOLDER: Internal link to “Best Technical Indicators for Forex Trading”]
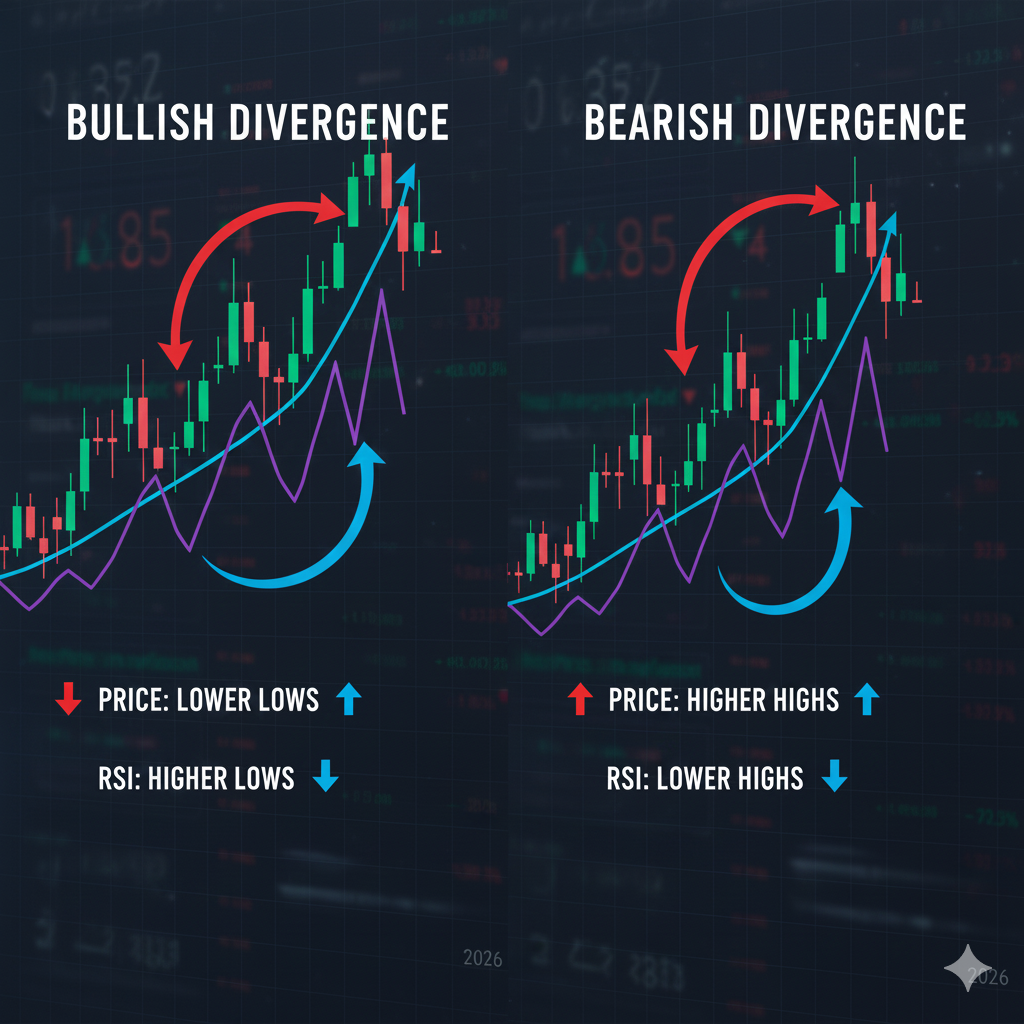
How to Identify Bullish RSI Divergence
Bullish divergence signals a potential reversal from downtrend to uptrend. Here’s exactly how to spot it.
The Four Requirements for Valid Bullish Divergence
Requirement 1: Price Action
- Price must make a lower low (LL)
- The second low must be lower than the first low
- This shows the downtrend is technically continuing
Requirement 2: RSI Action
- RSI must make a higher low (HL)
- The second RSI low must be higher than the first RSI low
- This shows momentum is actually improving despite lower prices
Requirement 3: Time Alignment
- The RSI lows must correspond to the price lows
- They should occur at approximately the same time
- Draw a line connecting both RSI lows to visualize
Requirement 4: Context
- Best when occurring in oversold territory (RSI below 30-40)
- Stronger when at a support level
- More reliable on higher timeframes (4H, daily)
Step-by-Step Process to Identify Bullish Divergence
Step 1: Look for a downtrend (series of lower lows and lower highs)
Step 2: Identify the first significant low in price and mark it with a point
Step 3: Find the corresponding RSI value at that same time and mark it
Step 4: Wait for price to make a new lower low
Step 5: Check the RSI value at this new low point
Step 6: If RSI has made a higher low (not lower), you have bullish divergence
Step 7: Draw a line connecting the two price lows (should slope downward)
Step 8: Draw a line connecting the two RSI lows (should slope upward)
Step 9: The diverging lines confirm the setup

Bullish Divergence Example
EUR/USD – 4-Hour Chart
Point A (First Low):
- Date: Monday 8:00 AM
- Price: 1.0750
- RSI: 28
Point B (Second Low):
- Date: Wednesday 4:00 PM
- Price: 1.0720 (30 pips lower)
- RSI: 35 (7 points higher!)
Analysis: Price made a lower low (bearish), but RSI made a higher low (bullish). This divergence signaled that selling pressure was weakening. The downtrend was running out of steam despite making new lows.
Result: EUR/USD reversed and rallied 150 pips over the next 5 days from 1.0720 to 1.0870.
How to Identify Bearish RSI Divergence
Bearish divergence signals a potential reversal from uptrend to downtrend.
The Four Requirements for Valid Bearish Divergence
Requirement 1: Price Action
- Price must make a higher high (HH)
- The second high must be higher than the first high
- Shows the uptrend is technically continuing
Requirement 2: RSI Action
- RSI must make a lower high (LH)
- The second RSI high must be lower than the first RSI high
- Shows momentum is actually weakening despite higher prices
Requirement 3: Time Alignment
- The RSI highs must correspond to the price highs
- Should occur at approximately the same time
- Connect both RSI highs with a line to visualize
Requirement 4: Context
- Best when occurring in overbought territory (RSI above 60-70)
- Stronger when at a resistance level
- More reliable on higher timeframes
Step-by-Step Process to Identify Bearish Divergence
Step 1: Look for an uptrend (series of higher highs and higher lows)
Step 2: Identify the first significant high in price and mark it
Step 3: Find the corresponding RSI value at that same time and mark it
Step 4: Wait for price to make a new higher high
Step 5: Check the RSI value at this new high point
Step 6: If RSI has made a lower high (not higher), you have bearish divergence
Step 7: Draw a line connecting the two price highs (should slope upward)
Step 8: Draw a line connecting the two RSI highs (should slope downward)
Step 9: The diverging lines confirm the setup
[IMAGE PLACEHOLDER: Annotated chart showing step-by-step bearish divergence identification with numbered steps – Alt text: “How to identify bearish RSI divergence step by step on forex chart”]
Bearish Divergence Example
GBP/USD – Daily Chart
Point A (First High):
- Date: March 5th
- Price: 1.2650
- RSI: 73
Point B (Second High):
- Date: March 15th
- Price: 1.2720 (70 pips higher)
- RSI: 68 (5 points lower!)
Analysis: Price made a higher high (bullish), but RSI made a lower high (bearish). This warned that buying pressure was diminishing. The uptrend was losing momentum.
Result: GBP/USD reversed and declined 200 pips over the next 10 days from 1.2720 to 1.2520.
Regular vs. Hidden Divergence
There are actually two categories of divergence: regular and hidden. Each serves a different purpose.
Regular Divergence (Trend Reversal Signal)
This is what we’ve been discussing so far:
Regular Bullish Divergence:
- Price: Lower low
- RSI: Higher low
- Signal: Downtrend may reverse to uptrend
- Action: Look for long entries
Regular Bearish Divergence:
- Price: Higher high
- RSI: Lower high
- Signal: Uptrend may reverse to downtrend
- Action: Look for short entries
Use: Trade reversals at the end of trends
Hidden Divergence (Trend Continuation Signal)
Hidden divergence signals that a trend will continue after a pullback:
Hidden Bullish Divergence:
- Price: Higher low (making a pullback in uptrend)
- RSI: Lower low
- Signal: Uptrend will resume
- Action: Look for long entries on the pullback
Hidden Bearish Divergence:
- Price: Lower high (making a pullback in downtrend)
- RSI: Higher high
- Signal: Downtrend will resume
- Action: Look for short entries on the pullback
Use: Trade with the trend after temporary corrections
Important: For beginners, focus on regular divergence first. It’s more straightforward and provides clearer signals. Add hidden divergence to your arsenal once you’ve mastered regular divergence.
[LINK PLACEHOLDER: Internal link to “Trend Trading vs Counter-Trend Trading Strategies”]
Complete RSI Divergence Trading Strategy
Now let’s put it all together into a complete, actionable trading strategy.
Strategy Overview
Timeframes: 4-hour and daily charts (most reliable) Currency Pairs: Major pairs (EUR/USD, GBP/USD, USD/JPY) Win Rate: 60-70% with proper risk management Risk-Reward: Minimum 1:2, typically 1:3 Trading Style: Swing trading (positions held 3-10 days)
Strategy Setup Requirements
Indicator Settings:
- RSI (14) with levels at 30, 50, and 70
- Add 20 EMA and 50 EMA (optional but helpful for context)
- Support and resistance levels marked
Chart Preparation:
- Clean chart with minimal clutter
- Price candles clearly visible
- RSI indicator in separate panel below price
- Enough historical data to identify trends (50-100 candles)
Bullish Divergence Trading Rules
Entry Conditions (ALL Must Be Met):
- Divergence Confirmation
- Clear bullish divergence identified (price LL, RSI HL)
- Both lows clearly marked and connected with lines
- Price Action Confirmation
- Wait for bullish candle close after second low
- Ideally a bullish engulfing or pin bar
- Price should start moving above the second low
- RSI Position
- RSI must be below 50 (preferably below 40)
- RSI beginning to turn upward
- Crossing above 30 is a strong additional signal
- Support Level (Optional but Stronger)
- Divergence occurring at a major support zone
- Previous low, round number, or Fibonacci level
- Adds confluence and strength to setup
Entry Trigger:
- Enter LONG at the open of the candle after the bullish confirmation candle
- Or place a buy stop 3-5 pips above the high of the confirmation candle
Stop Loss Placement:
- Place 10-20 pips below the divergence low (point B)
- Or below the nearest support level
- Never risk more than 2% of your account
Take Profit Targets:
- Target 1: Recent swing high (close 50% of position)
- Target 2: Next major resistance level (close remaining 50%)
- Alternative: Use 2:1 or 3:1 risk-reward ratio
Trade Management:
- Move stop to break-even when price reaches 1:1 risk-reward
- Trail stop loss below swing lows as trade progresses
- Watch for bearish divergence at highs to signal exit
[IMAGE PLACEHOLDER: Complete bullish divergence trade setup showing entry, stop loss, targets, and price action – Alt text: “Complete RSI bullish divergence trade example with entry rules and exit strategy”]
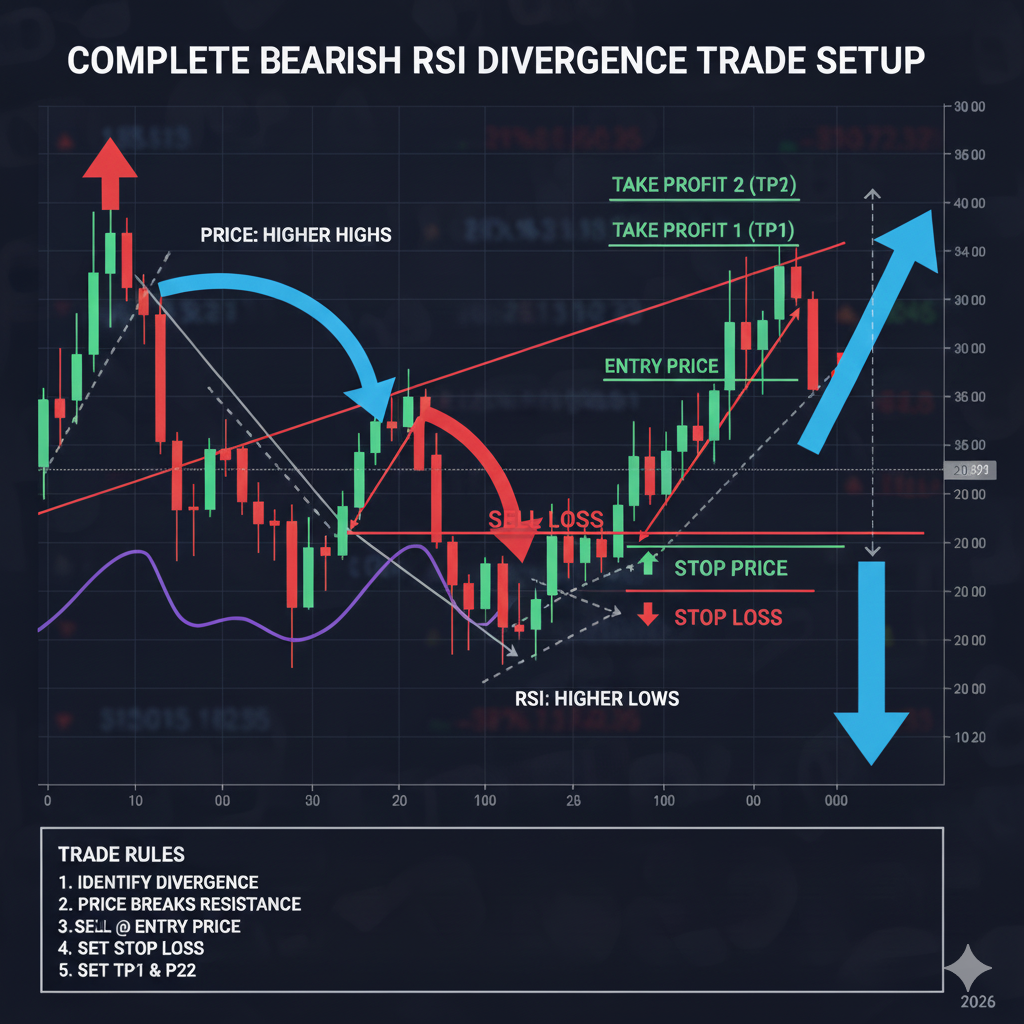
Bearish Divergence Trading Rules
Entry Conditions (ALL Must Be Met):
- Divergence Confirmation
- Clear bearish divergence identified (price HH, RSI LH)
- Both highs clearly marked and connected with lines
- Price Action Confirmation
- Wait for bearish candle close after second high
- Ideally a bearish engulfing or shooting star
- Price should start moving below the second high
- RSI Position
- RSI must be above 50 (preferably above 60)
- RSI beginning to turn downward
- Crossing below 70 is a strong additional signal
- Resistance Level (Optional but Stronger)
- Divergence occurring at a major resistance zone
- Previous high, round number, or Fibonacci level
- Adds confluence to the setup
Entry Trigger:
- Enter SHORT at the open of the candle after the bearish confirmation candle
- Or place a sell stop 3-5 pips below the low of the confirmation candle
Stop Loss Placement:
- Place 10-20 pips above the divergence high (point B)
- Or above the nearest resistance level
- Maximum 2% account risk
Take Profit Targets:
- Target 1: Recent swing low (close 50% of position)
- Target 2: Next major support level (close remaining 50%)
- Alternative: Use 2:1 or 3:1 risk-reward ratio
Trade Management:
- Move stop to break-even at 1:1 risk-reward
- Trail stop loss above swing highs as trade progresses
- Watch for bullish divergence at lows to signal exit
[IMAGE PLACEHOLDER: Complete bearish divergence trade setup showing entry, stop loss, targets, and price action – Alt text: “Complete RSI bearish divergence trade example with entry rules and exit strategy”]
Real Trading Examples – Complete Breakdown
Let’s examine three real trades to see exactly how this strategy works in practice.
Example 1: EUR/USD Bullish Divergence (Winner)
Setup Details:
- Pair: EUR/USD
- Timeframe: 4-Hour Chart
- Date: Early November 2023
Divergence Formation:
Point A (First Low):
- Date: November 2, 8:00 AM EST
- Price: 1.0580
- RSI: 27
- Context: Downtrend in progress
Point B (Second Low):
- Date: November 6, 12:00 PM EST
- Price: 1.0550 (30 pips lower than Point A)
- RSI: 33 (6 points higher than Point A)
- Context: Bullish divergence confirmed
Entry Setup:
Confirmation Candle:
- Date: November 6, 4:00 PM EST (next 4H candle)
- Bullish engulfing candle closed at 1.0570
- RSI crossed above 35 and turning upward
Trade Execution:
Entry: 1.0575 (next candle open) Stop Loss: 1.0530 (20 pips below Point B low) Risk: 45 pips
Targets:
- Target 1: 1.0665 (90 pips, recent swing high) – 2:1 RR
- Target 2: 1.0710 (135 pips, major resistance) – 3:1 RR
Trade Management:
November 7: Price reached 1.0620 (+45 pips). Moved stop loss to 1.0575 (break-even).
November 8: Target 1 hit at 1.0665. Closed 50% of position for +90 pips profit. Let remaining 50% run toward Target 2.
November 10: Target 2 hit at 1.0710. Closed remaining 50% for +135 pips profit.
Results:
- Average profit: 112.5 pips [(90 + 135) ÷ 2]
- Risk-reward achieved: 2.5:1
- Account growth: 2.25% on 2% risk (112.5% profit on risked capital)
Key Lessons:
- Divergence formed at strong support zone (added confluence)
- Patience waiting for confirmation candle paid off
- Moving stop to break-even protected profits
- Partial profit-taking secured gains while letting winners run
Example 2: GBP/USD Bearish Divergence (Winner)
Setup Details:
- Pair: GBP/USD
- Timeframe: Daily Chart
- Date: Mid-December 2023
Divergence Formation:
Point A (First High):
- Date: December 8
- Price: 1.2650
- RSI: 74
- Context: Strong uptrend
Point B (Second High):
- Date: December 14
- Price: 1.2705 (55 pips higher than Point A)
- RSI: 69 (5 points lower than Point A)
- Context: Bearish divergence confirmed at resistance
Entry Setup:
Confirmation Candle:
- Date: December 15
- Bearish engulfing candle closed at 1.2680
- RSI turned down from overbought and crossed below 70
Trade Execution:
Entry: 1.2675 (next day open) Stop Loss: 1.2730 (25 pips above Point B high) Risk: 55 pips
Targets:
- Target 1: 1.2565 (110 pips, recent swing low) – 2:1 RR
- Target 2: 1.2510 (165 pips, major support) – 3:1 RR
Trade Management:
December 16: Price dropped to 1.2620 (-55 pips). Moved stop loss to 1.2675 (break-even).
December 18: Target 1 hit at 1.2565. Closed 50% for +110 pips profit.
December 20: Price continued lower. Trailed stop to 1.2600 (below recent swing high).
December 21: Target 2 hit at 1.2510. Closed remaining 50% for +165 pips profit.
Results:
- Average profit: 137.5 pips [(110 + 165) ÷ 2]
- Risk-reward achieved: 2.5:1
- Account growth: 2.5% on 2% risk
Key Lessons:
- Daily timeframe provided clearer, stronger signal
- Divergence at overbought levels more reliable
- Breaking even quickly removed pressure
- Trailing stop captured extended move
[IMAGE PLACEHOLDER: Side-by-side charts showing both EUR/USD bullish and GBP/USD bearish divergence trades – Alt text: “Real RSI divergence trading examples showing successful bullish and bearish trades”]
Example 3: USD/JPY False Divergence (Loser)
Setup Details:
- Pair: USD/JPY
- Timeframe: 4-Hour Chart
- Date: Late January 2024
Divergence Formation:
Point A (First Low):
- Date: January 22, 4:00 PM EST
- Price: 148.50
- RSI: 32
Point B (Second Low):
- Date: January 24, 8:00 AM EST
- Price: 148.20 (30 pips lower)
- RSI: 36 (4 points higher)
- Context: Apparent bullish divergence
Entry Setup:
Confirmation Candle:
- January 24, 12:00 PM EST
- Small bullish candle closed at 148.35
- RSI beginning to turn up
Trade Execution:
Entry: 148.40 Stop Loss: 148.00 (40 pips below Point B) Risk: 40 pips
Target: 148.90 (50 pips) for 1.25:1 RR
What Went Wrong:
January 24, 8:00 PM EST: Major BoJ statement released unexpectedly. USD/JPY plunged.
January 25: Price broke through stop loss at 148.00, hitting 147.80 before bouncing.
Result: -40 pip loss (full risk)
Post-Analysis – Why It Failed:
- Weak confirmation candle – Should have waited for stronger bullish signal
- Shallow divergence – Only 4-point RSI difference (prefer 5+ points)
- No support confluence – Divergence didn’t occur at major support level
- News event – Fundamental factor overpowered technical setup
- Lower timeframe – 4H less reliable than daily for divergence
Key Lessons:
- Not every divergence works (60-70% win rate means 30-40% losers)
- Proper stop loss kept loss manageable (didn’t blow up account)
- Checking economic calendar could have prevented this trade
- This is why we risk only 1-2% per trade
- Failed trades are part of trading—move on to next setup
Important Reminder: Even with a 40-pip loss, proper risk management meant only a 0.8-1.2% account loss. This is easily recoverable with the next winning trade.
Combining RSI Divergence with Other Indicators
While RSI divergence is powerful alone, combining it with additional confirmation increases win rate significantly.
Support and Resistance Levels
Why It Helps: Divergence at major S/R levels is more reliable than random divergence in the middle of nowhere.
How to Apply:
- Mark key support/resistance zones on higher timeframes
- Only take divergence setups that occur at these levels
- Divergence + S/R confluence = A+ setup
Example: Bullish divergence at 1.1000 psychological level (strong support) is more reliable than divergence at 1.1073 (random price level).
[LINK PLACEHOLDER: Internal link to “How to Draw Support and Resistance Levels Like a Pro”]
Moving Averages
Why It Helps: MAs confirm trend direction and provide dynamic support/resistance.
How to Apply:
- Add 50 EMA and 200 EMA to your chart
- Bullish divergence: More powerful when price is near 50/200 EMA support
- Bearish divergence: More powerful when price is near 50/200 EMA resistance
- Wait for price to cross MA after divergence for extra confirmation
Example: Bullish divergence with price bouncing off 200 EMA = very strong buy signal
MACD Confirmation
Why It Helps: MACD is another momentum indicator that can confirm RSI divergence signals.
How to Apply:
- Add MACD (12, 26, 9) below RSI
- Look for MACD to also show divergence
- When both RSI and MACD show divergence = stronger signal
- MACD histogram should be decreasing in bearish div, increasing in bullish div
Example: If RSI shows bearish divergence AND MACD shows bearish divergence simultaneously, the signal is much more reliable.
Fibonacci Retracement
Why It Helps: Divergence at key Fibonacci levels (38.2%, 50%, 61.8%) is more significant.
How to Apply:
- Draw Fibonacci from recent swing high to swing low (or vice versa)
- Look for divergence to form at 50% or 61.8% retracement levels
- These levels often mark reversal zones
- Adds mathematical confluence to your setup
Candlestick Patterns
Why It Helps: Strong reversal candlesticks confirm that the divergence reversal is actually happening.
How to Apply:
For Bullish Divergence, look for:
- Bullish engulfing candle
- Hammer or inverted hammer
- Morning star pattern
- Bullish pin bar
For Bearish Divergence, look for:
- Bearish engulfing candle
- Shooting star
- Evening star pattern
- Bearish pin bar
Rule: Don’t enter until you see a strong reversal candle after divergence formation.
Best Timeframes for RSI Divergence Trading
Divergence can appear on any timeframe, but reliability varies significantly.
Most Reliable: Daily and 4-Hour Charts
Daily Chart:
- Pros: Most reliable signals, clearest trends, less false signals
- Cons: Fewer setups (1-3 per month per pair), requires patience
- Best for: Swing traders, position traders
- Win rate: 65-75%
4-Hour Chart:
- Pros: Good balance of reliability and frequency (1-2 per week per pair)
- Cons: More false signals than daily
- Best for: Swing traders with more active approach
- Win rate: 60-70%
Moderate Reliability: 1-Hour Chart
1-Hour Chart:
- Pros: More frequent setups (several per week)
- Cons: More false signals, requires more monitoring
- Best for: Active day traders
- Win rate: 55-65%
Less Reliable: 15-Minute and Lower
15-Minute and Below:
- Pros: Many signals daily
- Cons: High false signal rate, market noise, spread costs
- Best for: Experienced scalpers only
- Win rate: 50-60% (not recommended for divergence trading)
Recommendation: Start with daily charts to learn divergence patterns. Once consistently profitable, experiment with 4-hour charts. Avoid lower timeframes until you’re very experienced.
Common Mistakes and How to Avoid Them
Mistake #1: Trading Every Divergence
The Problem: Seeing divergence and immediately entering without additional confirmation or context.
Why It Fails: Not all divergences result in reversals. Some are false signals, especially on lower timeframes or in strong trends.
The Fix:
- Wait for price action confirmation (reversal candle)
- Check for confluence with S/R levels
- Verify RSI is in appropriate zone (below 40 for bullish, above 60 for bearish)
- Only trade A-grade setups with multiple confirmations
Mistake #2: Ignoring the Trend
The Problem: Taking bullish divergence during a strong downtrend or bearish divergence during a strong uptrend.
Why It Fails: The trend is your friend. Fighting strong trends, even with divergence, often fails.
The Fix:
- Use daily/weekly charts to identify major trend
- Prefer divergence trades that align with higher timeframe trends
- If counter-trend, wait for very strong divergence with multiple confirmations
- Consider hidden divergence (trend continuation) instead
[LINK PLACEHOLDER: Internal link to “How to Identify Forex Trends on Multiple Timeframes”]
Mistake #3: Drawing Divergence Lines Incorrectly
The Problem: Connecting random highs/lows or forcing divergence to appear where it doesn’t exist.
Why It Fails: False divergences lead to poor trades and losses.
The Fix:
- Connect CORRESPONDING highs/lows (same time period)
- Use significant swing highs/lows, not every minor fluctuation
- Lines should be clear and obvious—if you’re squinting, it’s not real
- When in doubt, wait for clearer divergence
Mistake #4: Not Waiting for Confirmation
The Problem: Entering the trade as soon as you spot divergence, before price confirms the reversal.
Why It Fails: Price might continue trending despite divergence. Divergence is a warning, not an entry signal itself.
The Fix:
- Always wait for a reversal candle to close
- Watch for RSI to turn direction (up for bullish, down for bearish)
- Consider using a buy/sell stop entry above/below confirmation candle
- Patience prevents premature entries
Mistake #5: Poor Risk Management
The Problem: Risking too much (5-10% of the account) on divergence trades because “the signal is so strong.”
Why It Fails: Even the strongest divergence setups fail 30-40% of the time. Large risks = account destruction.
The Fix:
- Never risk more than 1-2% per trade
- Use proper stop loss placement (below/above divergence point)
- Accept that losses are part of trading
- Focus on overall profitability across many trades, not individual trade outcomes
Mistake #6: Chasing Missed Setups
The Problem: Spotting divergence after price has already reversed and moved significantly, then entering late.
Why It Fails: Late entries have poor risk-reward ratios and often catch the end of the reversal move.
The Fix:
- If you missed the entry, let it go
- Wait for the next setup—there’s always another trade
- Use alerts to catch divergences as they form
- Review charts regularly during your trading sessions
RSI Divergence Checklist
Use this checklist before every trade to ensure quality setups:
Pre-Entry Checklist
Divergence Quality: ☐ Clear price pattern (LL for bullish, HH for bearish) ☐ Clear opposite RSI pattern (HL for bullish, LH for bearish) ☐ Lines connecting highs/lows clearly diverge ☐ At least 5-point RSI difference between points ☐ Timeframe is 4-hour or daily
Context: ☐ RSI in appropriate zone (below 40 bullish, above 60 bearish) ☐ Divergence at or near support/resistance level ☐ No major news events scheduled in next 24 hours ☐ Adequate time until weekend (avoid Friday setups)
Confirmation: ☐ Strong reversal candle closed ☐ RSI turning in reversal direction ☐ Price breaking through recent minor swing ☐ Additional indicator confirmation (MA, MACD, etc.)
Risk Management: ☐ Stop loss placement identified (10-30 pips from entry) ☐ Risk is 1-2% of account maximum ☐ Target 1 and Target 2 identified ☐ Risk-reward ratio is minimum 1:2 ☐ Position size calculated correctly
Trading Conditions: ☐ Trading during high liquidity session ☐ Spreads are normal/tight ☐ No other open trades creating excessive total risk ☐ Mentally and emotionally prepared to trade
If all boxes are checked, the trade has high probability of success. If any critical boxes are unchecked, skip the trade and wait for a better setup.
Tracking and Improving Your Divergence Trading
Keep a Detailed Trading Journal
Record every divergence trade with:
Pre-Trade Information:
- Date and time of divergence formation
- Currency pair and timeframe
- Screenshots of the setup
- Confluence factors present
- Your analysis and reasoning
Trade Execution:
- Entry price, stop loss, targets
- Position size and risk percentage
- Entry type (
Trade Execution:
- Entry price, stop loss, targets
- Position size and risk percentage
- Entry type (</parameter> <parameter name=”new_str”>Trade Execution:
- Entry price, stop loss, targets
- Position size and risk percentage
- Entry type (market, limit, stop order)
- Time of entry
Trade Management:
- When stop moved to break-even
- Target 1 hit (yes/no, price)
- Target 2 hit (yes/no, price)
- Trailing stop adjustments
- Final exit price and reason
Post-Trade Analysis:
- Win or loss
- Pips gained/lost
- Percentage return
- What went right
- What could improve
- Lessons learned
Review Your Statistics Monthly
Key Metrics to Track:
Overall Performance:
- Total divergence trades taken
- Win rate percentage
- Average winner in pips
- Average loser in pips
- Profit factor (gross profit ÷ gross loss)
- Overall pips gained/lost
By Timeframe:
- Daily chart win rate vs 4-hour chart win rate
- Which timeframe produces better results?
- Consider focusing on your strongest timeframe
By Divergence Type:
- Bullish divergence win rate
- Bearish divergence win rate
- Do you perform better with one type?
By Currency Pair:
- EUR/USD performance
- GBP/USD performance
- USD/JPY performance
- Focus on pairs where you excel
By Market Conditions:
- Win rate during trending markets
- Win rate during ranging markets
- Win rate at major S/R levels vs random levels
Use this data to refine your strategy and focus on your strengths.
Progressive Improvement Plan
Month 1-2: Foundation
- Take only daily chart divergences
- Require strong confluence (S/R + divergence minimum)
- Focus on identifying valid setups
- Target: 5-10 trades, 55%+ win rate
Month 3-4: Expansion
- Add 4-hour chart divergences
- Experiment with additional confirmations (MACD, MAs)
- Refine entry timing
- Target: 10-15 trades, 60%+ win rate
Month 5-6: Optimization
- Analyze which setups perform best
- Double down on A+ setups
- Eliminate or reduce lower-performing setups
- Target: 15-20 trades, 65%+ win rate
Month 7+: Mastery
- Consistently profitable
- Confident in identifying and executing setups
- May explore hidden divergence
- May add additional pairs
- Target: 20+ trades monthly, 65-70%+ win rate
[LINK PLACEHOLDER: Internal link to “How to Keep a Forex Trading Journal That Improves Results”]
Frequently Asked Questions
Is RSI divergence reliable?
RSI divergence is one of the more reliable technical signals when used correctly, with win rates typically between 60-70% on daily and 4-hour charts. However, reliability depends heavily on timeframe (higher is better), confluence with other factors, and proper confirmation. It’s not infallible, which is why risk management remains crucial.
What is the best RSI setting for divergence trading?
The standard RSI (14) setting works best for divergence trading. While some traders experiment with RSI (9) for more sensitivity or RSI (21) for smoother signals, the default 14-period setting strikes the right balance and is what most professional traders use. Stick with 14 unless you have extensive experience testing other settings.
Can you trade RSI divergence on 5-minute charts?
While technically possible, trading RSI divergence on 5-minute or lower timeframes is not recommended due to excessive false signals and market noise. The risk-reward becomes unfavorable when spread costs are factored in. Stick to 4-hour and daily charts for best results, or 1-hour charts minimum if you’re an experienced trader.
Should I wait for RSI to cross 50 before entering?
Not necessarily. While RSI crossing 50 (from below for bullish, from above for bearish) adds confirmation, it’s not required. The key is waiting for: (1) divergence formation, (2) reversal candle close, and (3) RSI turning in the reversal direction. Some strong reversals happen before RSI reaches 50.
How often does RSI divergence occur?
On daily charts, expect 1-3 clear divergence setups per month per currency pair. On 4-hour charts, you might see 1-2 per week. The frequency depends on market conditions—ranging markets produce fewer divergences than trending markets that eventually exhaust. Quality over quantity is key.
What’s the difference between RSI and MACD divergence?
Both measure momentum divergence, but RSI is a bounded oscillator (0-100) while MACD is unbounded. RSI divergence is generally easier for beginners to spot and interpret. Many traders use both together for confirmation—when RSI and MACD both show divergence simultaneously, the signal is particularly strong.
Can RSI divergence predict exact reversal points?
No. Divergence signals that momentum is weakening and a reversal is likely, but it doesn’t pinpoint exact reversal timing. This is why confirmation candles are essential—they indicate the reversal is actually beginning. Divergence is a warning sign, not a precise entry signal by itself.
Conclusion: Mastering RSI Divergence Trading
RSI divergence is a powerful tool that can dramatically improve your trading results by helping you spot trend reversals before they become obvious to the masses. While it takes practice to identify divergences quickly and accurately, the edge it provides is well worth the learning curve.
Key Takeaways:
✅ Divergence reveals weakness – When price and momentum disagree, pay attention ✅ Higher timeframes are more reliable – Daily and 4-hour charts produce the best signals ✅ Always wait for confirmation – Divergence alone isn’t an entry signal ✅ Combine with confluence – S/R levels, MAs, and candlesticks increase win rate ✅ Manage risk religiously – Even great signals fail 30-40% of the time ✅ Track your results – Let data guide your improvement ✅ Be patient and selective – Quality setups, not quantity, drive profitability
Your Action Plan:
This Week:
- Add RSI (14) to your charts
- Study historical charts and identify divergences
- Practice drawing divergence lines correctly
- Create your divergence checklist
This Month:
- Trade divergences on demo account
- Take 5-10 practice trades
- Focus on daily chart setups only
- Build confidence in identification and execution
Next 3 Months:
- Transition to live trading with small positions
- Maintain detailed trading journal
- Review and analyze every trade
- Refine your approach based on results
Long Term:
- Develop expertise in divergence trading
- Expand to multiple currency pairs
- Consider adding hidden divergence
- Combine with your other strategies
Remember, RSI divergence isn’t a “holy grail” that wins every time. It’s simply a high-probability setup that, when combined with proper risk management and disciplined execution, can give you a consistent edge in the market. The traders who succeed with divergence are those who remain patient, follow their rules, and continuously learn from each trade.
Start identifying divergences today. Open your charts, add the RSI indicator, and begin spotting these powerful reversal signals. With practice, you’ll develop an eye for divergence that can transform your trading results and give you the confidence to trade market reversals profitably.