Price Action Trading Without Indicators (Complete Beginner Guide) – 2026
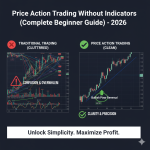
Price action trading is the art of making trading decisions based purely on price movement—no indicators, no oscillators, no clutter. It’s how professional traders read the market, and it’s arguably the most powerful trading approach you can learn. While indicators can be helpful, they’re all derived from price anyway, so why not learn to read the source directly?
In this comprehensive guide, you’ll learn everything about price action trading from absolute basics to complete strategies. You’ll discover how to read candlestick patterns, identify support and resistance, spot high-probability setups, and trade with confidence using nothing but a clean chart and price itself. By the end, you’ll understand why many professional traders rely primarily on price action and how you can too.
What is Price Action Trading?
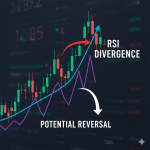
Price action trading is a methodology that analyzes the actual movement of price on a chart without the use of lagging indicators. Instead of relying on RSI, MACD, or moving averages, price action traders read “naked” charts and make decisions based on:
- Candlestick patterns – What individual candles and candle formations tell us
- Support and resistance – Where price has previously reacted
- Trend structure – Higher highs/lows or lower highs/lows
- Chart patterns – Recognizable formations that precede moves
- Price behavior – How price moves, not just where it moves
Why Price Action Works
Price represents the ultimate truth of market sentiment:
Price reflects everything:
- All economic data
- All political events
- All trader emotions
- All supply and demand
- All market psychology
When you read price action, you’re reading:
- Where buyers and sellers previously battled
- Where institutions placed large orders
- Where traders got trapped
- Where momentum is building or fading
- Where the next big move is likely to occur
The key insight: Indicators simply process historical price data. Why use a derivative when you can read the original?
The Foundation: Understanding Candlesticks
Before you can read price action, you must understand candlesticks—the building blocks of price movement.
Candlestick Anatomy
Each candlestick shows four critical pieces of information:
The Body (Rectangle):
- Open – Price at candle start
- Close – Price at candle end
- Bullish candle (white/green) – Close above open (buyers won)
- Bearish candle (black/red) – Close below open (sellers won)
The Wicks/Shadows (Lines):
- Upper wick – Highest price reached
- Lower wick – Lowest price reached
- Wicks show rejected prices
What Candlesticks Really Tell You
Large Body = Strong Conviction
- Buyers or sellers in full control
- Momentum is strong
- Trend likely to continue
Small Body = Indecision
- Battle between buyers and sellers
- Uncertainty in the market
- Potential trend change or consolidation
Long Upper Wick = Rejection of Higher Prices
- Bulls tried to push higher but failed
- Sellers stepped in with force
- Bearish signal
Long Lower Wick = Rejection of Lower Prices
- Bears tried to push lower but failed
- Buyers stepped in with force
- Bullish signal
[LINK PLACEHOLDER: Internal link to “Candlestick Patterns Every Forex Trader Must Know”]
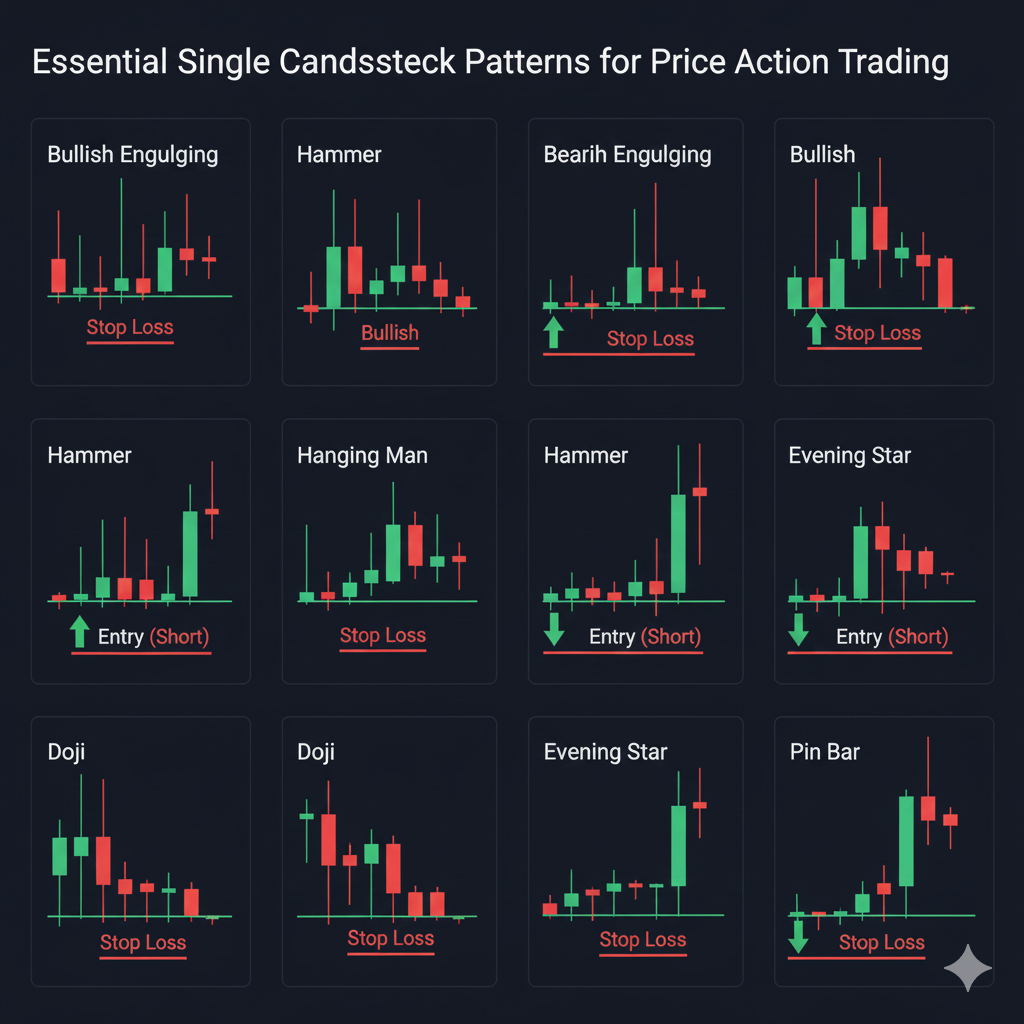
Essential Single-Candle Patterns
Certain candlestick formations provide high-probability trading signals on their own.
The Pin Bar (Hammer/Shooting Star)
Characteristics:
- Small body (less than 1/3 of total length)
- Long wick (2-3× body length)
- Minimal wick on opposite side
- Shows strong rejection
Bullish Pin Bar (Hammer):
- Long lower wick
- Small body at top
- Forms at support/downtrend low
- Buyers rejected lower prices
- Signal: Potential reversal upward
Bearish Pin Bar (Shooting Star):
- Long upper wick
- Small body at bottom
- Forms at resistance/uptrend high
- Sellers rejected higher prices
- Signal: Potential reversal downward
Trading Pin Bars:
- Entry: Above bullish pin bar high, below bearish pin bar low
- Stop: Beyond the pin bar wick
- Target: 2-3× the pin bar size
Strength Factors:
- Longer wick = stronger signal
- Smaller body = better
- Closes near the “good” end (high for bullish, low for bearish)
- Appears at key levels (S/R)
The Engulfing Pattern
Bullish Engulfing:
- Follows downtrend or at support
- Small bearish candle
- Next candle: Large bullish candle completely engulfs prior candle
- Shows buyers overwhelming sellers
- Strong reversal signal
Bearish Engulfing:
- Follows uptrend or at resistance
- Small bullish candle
- Next candle: Large bearish candle completely engulfs prior candle
- Shows sellers overwhelming buyers
- Strong reversal signal
Trading Rules:
- Enter on close of engulfing candle or next candle open
- Stop: Beyond engulfing candle high/low
- Target: Recent swing point or 2:1 risk-reward
The Doji – Indecision Candle
Characteristics:
- Open and close nearly identical
- Small or no body
- Wicks on both sides (usually)
- Shows complete balance between buyers and sellers
What It Means:
- In uptrend: Buyers losing control, potential reversal
- In downtrend: Sellers losing control, potential reversal
- In consolidation: Continued indecision, avoid trading
- After strong move: Exhaustion, expect reversal or consolidation
Trading Dojis:
- Don’t trade doji itself
- Wait for next candle to show direction
- Doji at key level + confirmation candle = strong signal
Inside Bar – Consolidation Pattern
Characteristics:
- Entire candle (high to low) contained within previous candle
- Shows consolidation/uncertainty
- Market “taking a breath”
- Often precedes explosive move
Trading Inside Bars:
- Wait for breakout above or below inside bar range
- Enter in breakout direction
- Stop: Opposite side of inside bar
- Expect strong momentum move
Best Context:
- Inside bar after strong trend move = continuation
- Inside bar at key level = potential reversal
- Multiple inside bars = major breakout coming
Multi-Candle Price Action Patterns
Multiple candles together often form powerful patterns.
Morning Star/Evening Star
Morning Star (Bullish Reversal):
- Large bearish candle (downtrend)
- Small-bodied candle (any color, shows indecision)
- Large bullish candle (closes above midpoint of candle 1)
Signal: Downtrend exhausted, reversal to uptrend
Evening Star (Bearish Reversal):
- Large bullish candle (uptrend)
- Small-bodied candle (indecision)
- Large bearish candle (closes below midpoint of candle 1)
Signal: Uptrend exhausted, reversal to downtrend
Trading:
- Enter after 3rd candle closes
- Stop beyond pattern extreme
- Target: 2-3× pattern height
Three White Soldiers / Three Black Crows
Three White Soldiers (Bullish):
- Three consecutive large bullish candles
- Each closes near its high
- Each opens within previous body
- Strong uptrend starting or accelerating
Three Black Crows (Bearish):
- Three consecutive large bearish candles
- Each closes near its low
- Each opens within previous body
- Strong downtrend starting or accelerating
Trading:
- Enter on 4th candle in direction of three
- These patterns are continuation signals
- Stop: Below/above the three candles
- Target: Distance equal to pattern height
Two-Bar Reversal
Bullish Two-Bar:
- Bar 1: Large bearish candle making new low
- Bar 2: Bullish candle closes above Bar 1 high
- Shows failed breakdown, buyer strength
Bearish Two-Bar:
- Bar 1: Large bullish candle making new high
- Bar 2: Bearish candle closes below Bar 1 low
- Shows failed breakout, seller strength
Trading:
- Very reliable at support/resistance
- Enter on bar 2 close or bar 3 open
- Tight stop beyond bar 1 extreme
- Excellent risk-reward ratio
Support and Resistance – The Foundation
Support and resistance are the most critical concepts in price action trading.
What Are Support and Resistance?
Support:
- Price level where buying pressure historically overcame selling pressure
- Floor that prevents price from falling further
- Previous lows, swing lows, psychological levels
Resistance:
- Price level where selling pressure historically overcame buying pressure
- Ceiling that prevents price from rising further
- Previous highs, swing highs, psychological levels
Why They Work:
- Market memory—traders remember these levels
- Institutional orders—banks place orders at previous levels
- Psychology—round numbers and previous turning points attract attention
- Self-fulfilling—everyone watches them, making them powerful
How to Draw Support and Resistance
The Wick vs Body Debate:
Option 1: Connect Wicks (More Aggressive)
- Use highest highs and lowest lows
- More precise levels
- Better for intraday trading
Option 2: Connect Bodies (More Conservative)
- Use candle close prices
- Creates zones rather than exact lines
- Better for swing trading
Recommendation: Use both, but think in zones rather than exact prices. Support/resistance is rarely a precise line—it’s a zone where price typically reacts.
Drawing Process:
Step 1: Zoom out to see 50-100 candles Step 2: Identify obvious swing highs and lows Step 3: Draw horizontal lines at these levels Step 4: Look for levels price touched 2+ times Step 5: Keep only the most significant levels (3-5 per chart) Step 6: Remove levels once price breaks through decisively
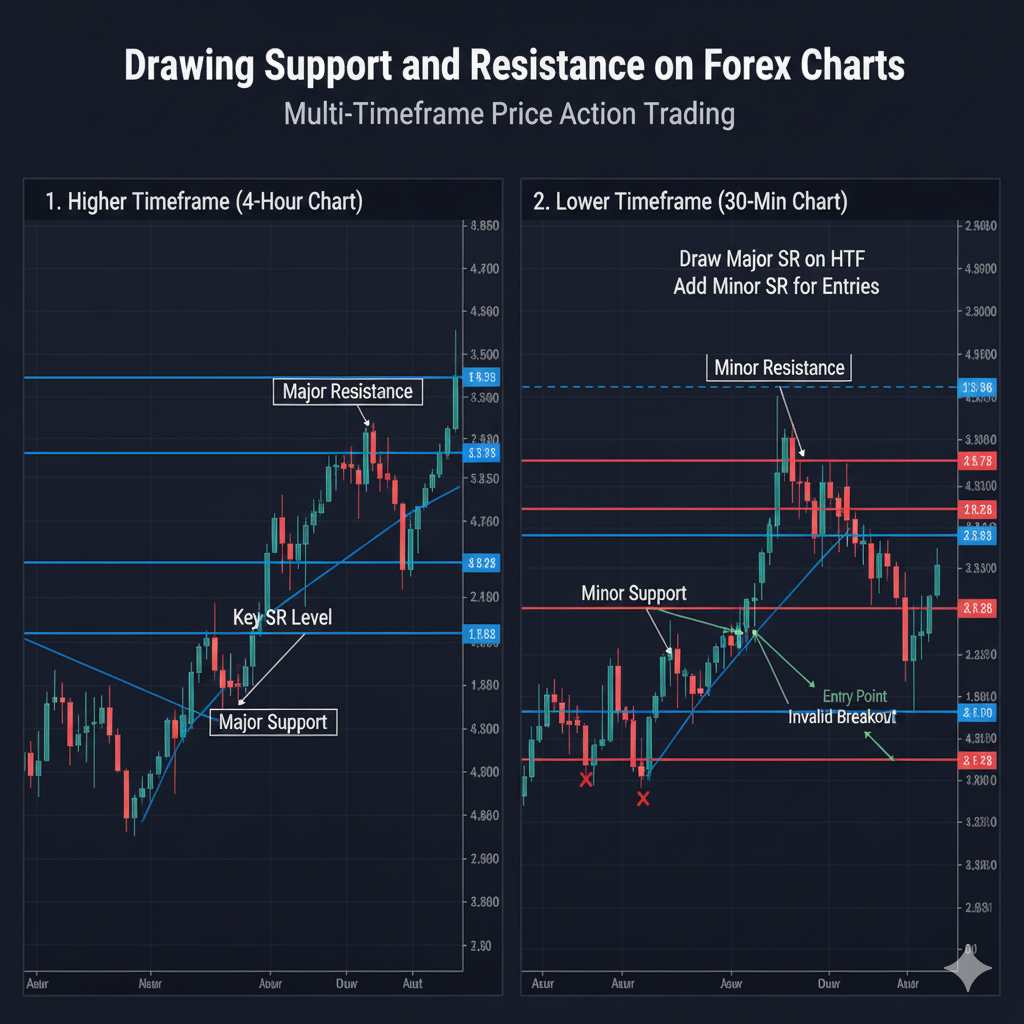
Support/Resistance Zones
Professional traders think in zones, not lines:
Creating Zones:
- Take key level (example: 1.1000)
- Add/subtract 5-10 pips (1.0995-1.1005)
- This zone accounts for wick penetrations
- Price reaction anywhere in zone confirms level
Zone Advantages:
- More realistic than expecting exact bounces
- Reduces false breakout frustration
- Allows for market noise
- More forgiving entry/exit timing
Psychological Levels (Round Numbers)
Certain price levels attract disproportionate attention:
Key Psychological Levels:
- 00 levels: 1.1000, 1.2000, 150.00
- 50 levels: 1.1050, 1.2150, 149.50
- Quarter levels: 1.1025, 1.1075 (less important)
Why They Matter:
- Easy to remember
- Institutions place orders at round numbers
- Stop losses cluster near these levels
- Self-fulfilling prophecies
Trading Tip: When S/R coincides with psychological level, the signal is much stronger.
Support Becomes Resistance (Role Reversal)
One of the most powerful price action concepts:
The Rule:
- Previous support, once broken, becomes new resistance
- Previous resistance, once broken, becomes new support
Why It Happens:
- Trapped traders—those who bought at support (now resistance) want to exit at breakeven
- Market memory—price “remembers” previous battle zones
- Order flow—stop losses and pending orders cluster at these levels
Trading Application:
- After support breaks, wait for price to rally back to test it as new resistance (short opportunity)
- After resistance breaks, wait for price to pull back to test it as new support (long opportunity)
These “retest” trades have excellent risk-reward ratios.
[LINK PLACEHOLDER: Internal link to “How to Draw Support and Resistance Levels Like a Pro”]
Trend Structure – Reading Price Flow
Understanding trend structure is essential for price action trading.
Defining Trends Through Price
Uptrend:
- Series of higher highs (HH)
- Series of higher lows (HL)
- Each pullback low is higher than the previous one
- Each rally high exceeds the previous one
Downtrend:
- Series of lower highs (LH)
- Series of lower lows (LL)
- Each rally high is lower than the previous one
- Each selloff low breaks the previous one
Ranging/Sideways:
- No clear higher highs or lower lows
- Price bouncing between support and resistance
- Horizontal price movement
- Avoid trading (or trade the range)
Trend Lines – Dynamic Support/Resistance
Drawing Uptrend Lines:
- Connect two or more higher lows
- Line should slope upward
- More touches = stronger trendline
- Price bouncing off line provides buy signals
Drawing Downtrend Lines:
- Connect two or more lower highs
- Line should slope downward
- More touches = stronger
- Price rejecting from line provides sell signals
Rules:
- Need minimum two points to draw
- Third touch often provides best trading opportunity
- Break of trendline signals potential trend change
- Don’t force trendlines—use only obvious ones
Break of Structure (BOS)
Break of Structure occurs when:
- Uptrend: Price breaks below most recent higher low
- Downtrend: Price breaks above most recent lower high
What It Means:
- Trend structure is broken
- Potential trend reversal or consolidation coming
- Time to exit trend-following trades
- Wait for clarity before new trades
Trading BOS:
- Don’t immediately counter-trend trade
- Wait for confirmation of new trend structure
- Look for failed BOS (fake breakout) back in trend direction
- Most reliable at key support/resistance levels
Complete Price Action Trading Strategies
Now let’s put everything together into actionable strategies.
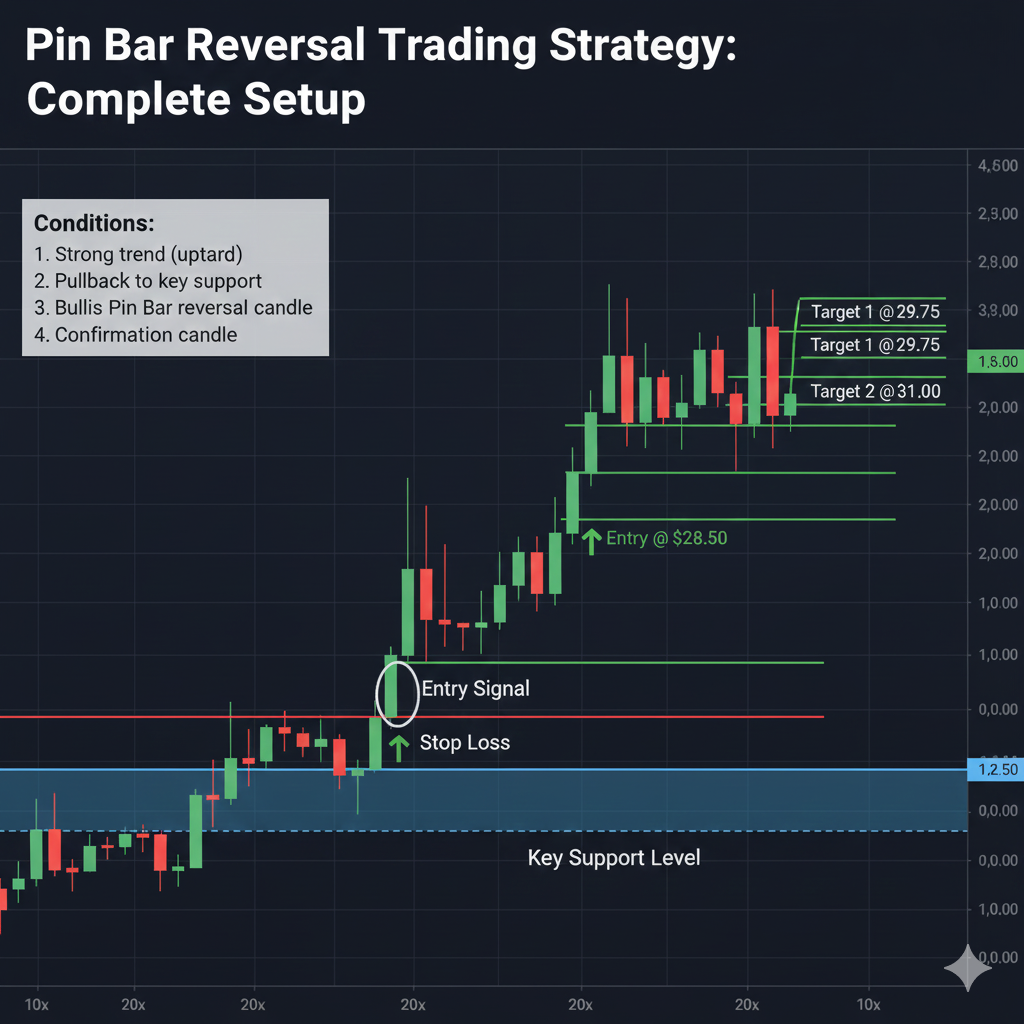
Strategy 1: Pin Bar Reversal at Key Levels
Setup Requirements:
1. Identify Key Level:
- Major support or resistance zone
- Previous swing high/low
- Psychological level (00, 50)
- Multiple timeframe confluence
2. Wait for Rejection:
- Price approaches key level
- Forms pin bar candle
- Long wick rejecting the level
- Small body near opposite end
3. Confirmation (Optional but Recommended):
- Next candle opens in favorable direction
- Volume increase (if available)
- No major news pending
Entry Rules:
Bullish Pin Bar at Support:
- Entry: 2-3 pips above pin bar high
- Or: Next candle open if clearly bullish
- Or: Use buy stop at pin high
Bearish Pin Bar at Resistance:
- Entry: 2-3 pips below pin bar low
- Or: Next candle open if clearly bearish
- Or: Use sell stop at pin low
Stop Loss:
- Place 5-10 pips beyond pin bar wick
- This is beyond the rejection point
- Maximum 2% account risk
Take Profit:
- Target 1: 2× the pin bar size (50% position)
- Target 2: Next major S/R level (50% position)
- Or: 2-3:1 risk-reward ratio
Trade Management:
- Move stop to breakeven at 1:1 risk-reward
- Trail stop if price continues favorably
- Exit immediately if price closes beyond pin bar wick
Best Conditions:
- Daily or 4-hour timeframes
- Pin bar at obvious level (not random)
- Confluence with trend direction preferred
- During high liquidity sessions
Strategy 2: Engulfing Pattern at Reversal Zones
Setup Requirements:
1. Identify Trend Exhaustion:
- Extended trend (uptrend for bearish, downtrend for bullish)
- Price at major support/resistance
- Signs of slowing momentum (smaller candles)
2. Spot Engulfing Pattern:
- Small candle in trend direction
- Large opposite candle completely engulfs it
- Engulfing candle closes beyond small candle extreme
3. Context Confirmation:
- Appearing at key S/R level
- Multiple timeframe alignment
- Time of day (high liquidity)
Entry Rules:
Bullish Engulfing (Long Entry):
- Entry: Open of next candle after engulfing
- Or: 2-3 pips above engulfing candle high
- Aggressive: Enter on engulfing candle close
Bearish Engulfing (Short Entry):
- Entry: Open of next candle after engulfing
- Or: 2-3 pips below engulfing candle low
- Aggressive: Enter on engulfing candle close
Stop Loss:
- Conservative: Beyond engulfing candle extreme (20-40 pips typical)
- Aggressive: Beyond small candle extreme (10-20 pips)
- Maximum 2% account risk
Take Profit:
- Target 1: Previous swing point (50% close)
- Target 2: 3:1 risk-reward (50% close)
- Let final portion trail with price
Trade Management:
- Break-even stop after 1.5:1 achieved
- Trail stop below/above each new swing
- Exit if price closes beyond engulfing candle
Success Factors:
- Strong engulfing candle (3-5× small candle)
- Appears at clear support/resistance
- Follows extended move in one direction
- Volume surge on engulfing candle (if available)
Strategy 3: Inside Bar Breakout
Setup Requirements:
1. Identify Inside Bar:
- Current candle’s high/low within previous candle’s range
- Shows consolidation
- Acts as coiled spring
2. Context is Critical:
- After strong trend move = continuation likely
- At support/resistance = reversal possible
- Multiple inside bars = stronger breakout
3. Timeframe:
- Daily chart most reliable
- 4-hour acceptable
- Lower timeframes less reliable
Entry Rules:
Bullish Breakout:
- Place buy stop 2-3 pips above inside bar high
- Only triggers if breakout occurs
- Anticipates upside continuation
Bearish Breakout:
- Place sell stop 2-3 pips below inside bar low
- Only triggers on breakdown
- Anticipates downside continuation
Bidirectional Setup (Advanced):
- Place both buy stop above and sell stop below
- First triggered is your trade
- Cancel opposite order immediately
- Only use if truly neutral on direction
Stop Loss:
- Opposite side of inside bar (low for longs, high for shorts)
- Or: Beyond mother bar (candle before inside bar)
- Maximum 2% risk
Take Profit:
- Target: Height of mother bar projected from breakout
- Or: 2-3:1 risk-reward
- Or: Next major S/R level
Trade Management:
- False breakouts common—be prepared
- Move to break-even quickly (after 30-50% to target)
- If price returns to inside bar, close trade (failed breakout)
Best Setup:
- Inside bar after strong trend move (continuation)
- Inside bar at key support/resistance (adds confluence)
- Multiple inside bars (shows compression)

Strategy 4: Support/Resistance Bounce
Setup Requirements:
1. Identify Clear Level:
- Price has reacted to this level 2+ times previously
- Level is obvious on chart
- Preferably coincides with psychological level
2. Price Approaches Level:
- Price trending toward S/R
- No immediate touch yet
- Anticipate reaction
3. Rejection Signal:
- Pin bar, engulfing, or strong reversal candle
- Appears at or very near S/R level
- Shows level is holding
Entry Rules:
At Support (Long):
- Entry: Above rejection candle high
- Or: Next candle open if bullish
- Wait for clear rejection confirmation
At Resistance (Short):
- Entry: Below rejection candle low
- Or: Next candle open if bearish
- Confirm resistance holding
Stop Loss:
- 10-20 pips beyond S/R level
- Or: Beyond rejection candle extreme
- Account for wick penetrations (S/R is zone)
Take Profit:
- Target 1: Opposite S/R level (50%)
- Target 2: 3:1 risk-reward (50%)
- Range traders: opposite side of range
Trade Management:
- Break-even stop after halfway to opposite level
- Trail if price continues beyond opposite level
- Exit if price closes beyond S/R zone (level broken)
Tips:
- Third touch of level often strongest
- Check higher timeframes for confluence
- Avoid if level has been tested many times (weakening)
- Best during trending markets approaching key levels
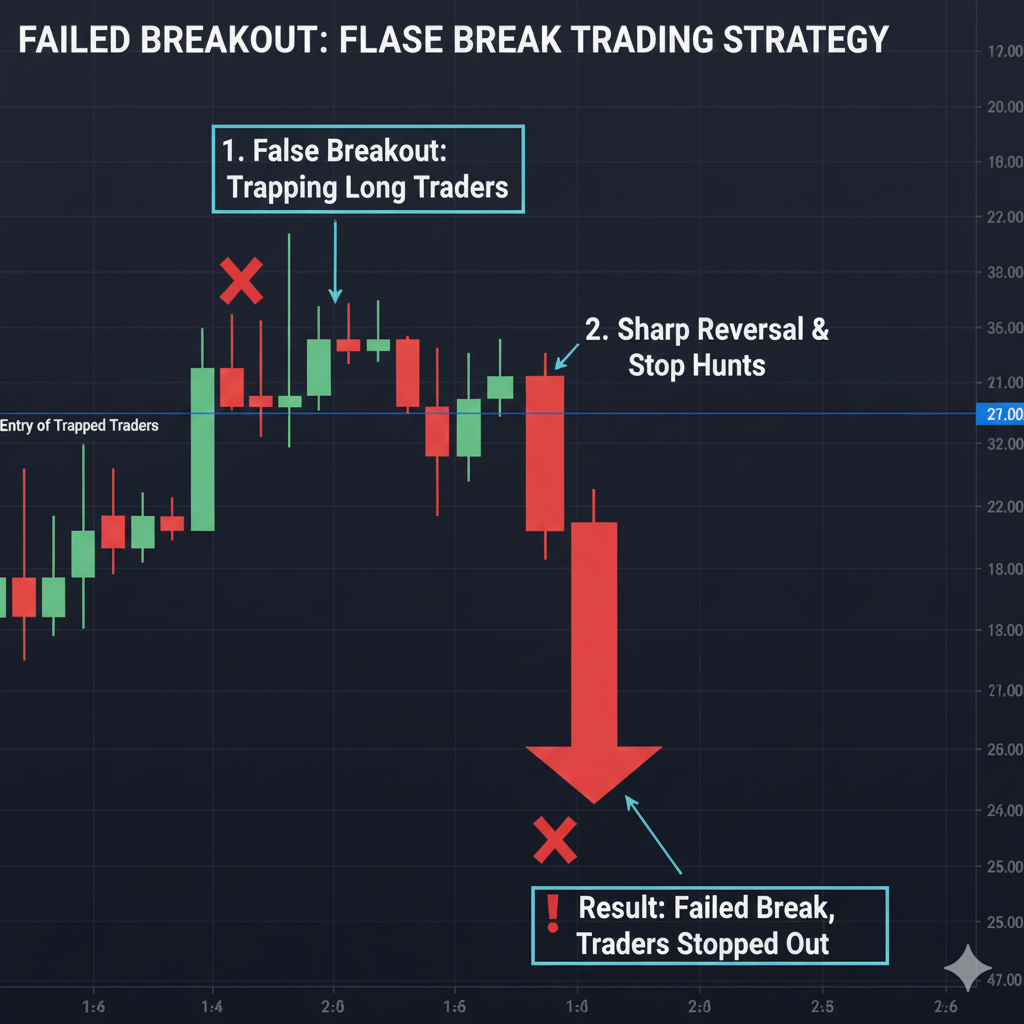
Strategy 5: Failed Breakout (False Break)
One of the most reliable price action setups:
Setup Requirements:
1. Identify Key Level:
- Major support or resistance
- Previous swing high/low
- Multiple tests of this level
2. Breakout Occurs:
- Price breaks through level
- Typically 10-20+ pips beyond
- Appears to be legitimate breakout
3. Reversal Happens:
- Price quickly returns back through level
- Closes on opposite side within 1-3 candles
- Shows breakout was false
What Happened:
- Stop losses triggered on wrong side
- Breakout traders trapped
- Market reverses sharply in opposite direction
Entry Rules:
Failed Breakout Above Resistance (Short):
- Price breaks above resistance
- Quickly reverses back below
- Entry: Just below resistance after close below it
- Or: Aggressive entry as soon as back through level
Failed Breakout Below Support (Long):
- Price breaks below support
- Quickly reverses back above
- Entry: Just above support after close above it
- Or: Aggressive entry on return through level
Stop Loss:
- 10-15 pips beyond false breakout high/low
- Beyond the “trap” zone
- This is tight—excellent risk-reward
Take Profit:
- Target: Distance from level to false breakout, projected opposite direction
- Or: Next major S/R level opposite side
- Often 50-150 pip moves
Why This Works:
- Trapped traders forced to exit
- Stop losses triggered create momentum
- Smart money faded the breakout
- High probability setup
Price Action on Different Timeframes
Price action principles apply across all timeframes, but approach varies.
Daily Charts – Most Reliable
Advantages:
- Clearest signals
- Less market noise
- Strongest S/R levels
- Best risk-reward
- Less screen time needed
Disadvantages:
- Fewer setups (1-3 per month per pair)
- Wider stop losses (40-80 pips)
- Requires patience
- Slower feedback
Best For: Swing traders, part-time traders, beginners
Recommended Approach:
- Check charts once or twice daily
- Trade only A+ setups
- Focus on major S/R levels
- Target multi-day moves
4-Hour Charts – Good Balance
Advantages:
- More frequent signals (1-2 per week per pair)
- Still reliable
- Moderate stops (25-50 pips)
- Good for active traders
Disadvantages:
- More monitoring required (4× daily)
- Some false signals
- Can miss extended moves
Best For: Active swing traders, serious part-timers
Recommended Approach:
- Check at session opens/closes
- Combine with daily chart context
- Focus on session high/low support/resistance
1-Hour Charts – Active Trading
Advantages:
- Multiple signals daily
- Shorter holding periods
- Can day trade with these
- Faster feedback
Disadvantages:
- More false signals
- Requires constant monitoring
- Psychological pressure
- More impacted by news
Best For: Day traders, full-time traders
Recommended Approach:
- Use daily/4H for trend context
- Trade only with higher timeframe trend
- Focus on high liquidity sessions
15-Minute and Below – Not Recommended
Issues:
- Excessive noise
- False breakouts constant
- Spread costs significant
- Pattern reliability drops
- Emotional toll high
Exception: Scalpers might use for timing entries from higher timeframe setups
[LINK PLACEHOLDER: Internal link to “How to Use Multiple Timeframe Analysis in Forex Trading”]
Common Price Action Mistakes
Mistake #1: Trading Every Pattern
The Problem: Seeing patterns everywhere and taking every setup without considering context.
Why It Fails: Not all pin bars, engulfings, or inside bars are equal. Context determines quality.
The Fix:
- Only trade patterns at key support/resistance
- Require trend context (with or against)
- Multiple timeframe confirmation
- High liquidity times only
- Quality over quantity always
Mistake #2: Ignoring Higher Timeframe Context
The Problem: Trading 1-hour pin bar bullish without seeing daily chart is in strong downtrend.
Why It Fails: Fighting higher timeframe trend = low win rate. Small timeframe signals get overrun by larger trend.
The Fix:
- Always check daily chart first
- Prefer trades aligned with daily trend
- Counter-trend only at major levels
- Use higher timeframe S/R levels
Mistake #3: Drawing Too Many Support/Resistance Lines
The Problem: Chart looks like spaghetti with lines everywhere. No level is special if everything is a level.
Why It Fails: Obscures the truly important levels. Causes analysis paralysis.
The Fix:
- Maximum 3-5 S/R levels per chart
- Only major, obvious levels count
- Remove levels once clearly broken
- Think quality, not quantity
Mistake #4: Not Giving Patterns Room to Work
The Problem: Placing stop loss 2 pips below pin bar wick because “that’s optimal.”
Why It Fails: Market needs breathing room. Wick penetrations normal. Overly tight stops get picked off.
The Fix:
- Add 5-10 pips buffer beyond pattern extreme
- Accept wider stops mean smaller position size
- Reduce position size, don’t tighten stop
- S/R zones, not lines
Mistake #5: Forcing Patterns That Aren’t There
The Problem: “That candle is kind of like a pin bar if I squint…”
Why It Fails: Confirmation bias. Seeing what you want to see instead of what’s actually there.
The Fix:
- Patterns should be obvious
- If you’re debating whether it’s valid, skip it
- Wait for clear, textbook setups
- Be patient—quality setups will come
Mistake #6: Trading Without Stop Losses
The Problem: “Price action traders read the market in real-time, they don’t need stops.”
Why It Fails: Nobody can watch charts 24/7. Unexpected events happen. Emotions take over.
The Fix:
- Always use stop losses
- Place them logically beyond pattern extremes
- Accept that stops will sometimes be hit
- Stops protect capital—non-negotiable
[IMAGE PLACEHOLDER: Split image showing price action mistakes vs correct approach – Alt text: “Common price action trading mistakes and how to avoid them”]
Building Your Price Action Skills
Phase 1: Pattern Recognition (Weeks 1-4)
Daily Practice:
- Study 30 minutes of historical charts
- Identify pin bars, engulfings, inside bars
- Mark support/resistance levels
- Note trend structure
- No trading yet—just learning to see
Goal: Recognize patterns instantly without hesitation
Phase 2: Context Understanding (Weeks 5-8)
Daily Practice:
- Same pattern recognition
- Add: analyze why patterns worked or failed
- Identify what made A+ setups
- Note market conditions during best setups
- Still no live trading
Goal: Understand context separates good setups from great ones
Phase 3: Demo Trading (Weeks 9-16)
Weekly Practice:
- Take 3-5 trades per week
- Screenshot every setup
- Journal entry reason, outcome, lessons
- Focus on execution, not P&L
- Build confidence in system
Goal: Prove consistency in demo before live trading
Phase 4: Live Trading Small (Months 5-6)
Weekly Practice:
- Start with 0.5-1% risk trades (half normal)
- Take only A+ setups
- Continue journaling religiously
- Focus on process over profits
- Build live trading experience
Goal: Transition to live without emotional interference
Phase 5: Full Implementation (Month 7+)
Ongoing:
- Full position sizing (2% risk max)
- Trade complete strategy
- Continue education and improvement
- Review journal monthly for patterns
- Refine based on results
Goal: Consistent, confident price action trading
[LINK PLACEHOLDER: Internal link to “How to Keep a Forex Trading Journal That Improves Results”]
Frequently Asked Questions
Can you really trade without any indicators?
Yes, many professional traders use pure price action without indicators. Price contains all the information you need—indicators simply process historical price data. That said, some traders combine price action with one or two key indicators (like 50/200 EMA for trend context). There’s no “right” answer—use what works for you.
How long does it take to learn price action trading?
Expect 3-6 months to become competent at recognizing patterns and another 3-6 months to develop consistent profitability. Price action is a skill like any other—it requires dedicated practice. Most traders need 6-12 months of serious study and practice before achieving consistent results.
What’s the best timeframe for price action trading?
Daily charts are best for beginners—clearest signals, least noise, most reliable. Once profitable on daily charts, you can explore 4-hour charts. Most professional price action traders primarily use daily and 4-hour timeframes. Avoid anything below 1-hour until you’re very experienced.
Do I still need to understand fundamentals?
Understanding fundamentals helps, but it’s not required for price action trading. Price reflects all fundamental information already. That said, knowing major news events (NFP, central bank decisions) helps you avoid trading during high-risk times. At minimum, use an economic calendar to avoid major releases.
How do I know if a support/resistance level is valid?
Valid S/R levels share these characteristics: (1) Price reacted strongly at least twice before, (2) Level is obvious on the chart without squinting, (3) Multiple timeframes show the same level, (4) Preferably coincides with psychological numbers. If you’re unsure whether a level is valid, it probably isn’t—trust obvious levels only.
Can price action work for scalping?
Price action principles work across all styles, but scalping with pure price action is challenging due to noise on lower timeframes. Most successful price action traders are swing traders or position traders using daily/4-hour charts. If you want to scalp, consider using price action on higher timeframes to determine trend, then scalp in that direction.
What’s more important: patterns or support/resistance?
Support/resistance is more foundational. Patterns increase probability but context (S/R levels, trend direction) determines whether patterns will work. A perfect pin bar in the middle of nowhere has low probability. A mediocre pin bar at major support with trend context has high probability. Context > Pattern quality.
Conclusion: Your Price Action Journey
Price action trading is a journey, not a destination. It’s a skill that develops over months and years of dedicated practice, not something you master from reading one article (even a comprehensive one like this). But the beauty of price action is that it never becomes obsolete—it’s based on human psychology and market structure that has existed for centuries and will continue indefinitely.
Key Takeaways:
✅ Price contains all information – Everything else is derivative ✅ Context determines everything – Same pattern, different context, different outcome ✅ Support/Resistance is foundation – Master this before anything else ✅ Quality over quantity always – One A+ setup beats ten mediocre ones ✅ Higher timeframes more reliable – Daily > 4-hour > 1-hour for beginners ✅ Patience is the edge – Wait for obvious setups at key levels ✅ Risk management still applies – Clean charts don’t eliminate risk ✅ Practice before trading – Months of chart study before live trading
Your Action Plan:
Month 1: Pure Study
- Study 100+ historical chart examples
- Identify every pin bar, engulfing, inside bar
- Mark support/resistance on 20+ charts
- Analyze why patterns worked or failed
- Zero trading—just observation
Month 2: Pattern Practice
- Continue pattern identification
- Start noting context (trend, S/R, timeframe)
- Study failed patterns—why they failed
- Begin understanding “quality” vs “quantity”
- Still no trading
Month 3: Demo Trading Begins
- Open demo account
- Take 2-3 trades per week maximum
- Screenshot every setup before entry
- Detailed journal for each trade
- Focus on execution, ignore P&L
Month 4-5: Building Confidence
- Increase to 5-8 trades per month
- Should see improving consistency
- Refine which patterns work best for you
- Identify your strengths (bullish vs bearish, certain timeframes)
- Continue demo until 2+ months of consistent profitability
Month 6+: Live Trading
- Start with 0.5-1% risk (half normal)
- Take only your highest-confidence setups
- Scale up gradually as consistency continues
- Never stop journaling and reviewing
- Continuous improvement mindset
Critical Success Factors:
🎯 Simplicity is strength – Don’t complicate what works simply 🎯 Discipline beats discretion – Follow your rules every time 🎯 Patience beats activity – Better to miss trades than force trades 🎯 Context beats pattern – Where pattern appears matters more than pattern itself 🎯 Higher timeframe beats lower – Clarity increases with timeframe 🎯 Consistency beats intensity – Daily 30-minute study beats 5-hour weekend binge 🎯 Process beats outcome – Focus on executing correctly, profits follow
Advanced Concepts to Explore Later:
Once you’ve mastered the basics (6-12 months), explore these advanced topics:
Order Blocks:
- Areas where institutions placed large orders
- Price often returns to these zones
- Advanced S/R concept
Supply and Demand Zones:
- More sophisticated approach to S/R
- Focus on imbalance areas
- Where price moved away quickly
Market Structure:
- Break of structure (BOS)
- Change of character (CHOC)
- Smart money concepts
Liquidity Grabs:
- Stop hunts above/below key levels
- Institutional accumulation/distribution
- Reading between the lines
Price Action + Volume:
- Volume confirms price moves
- Climax patterns
- Volume exhaustion signals
But remember: Master the basics first. These advanced concepts build on foundational price action skills. Don’t skip the fundamentals trying to find shortcuts—there aren’t any.
Final Thoughts:
Price action trading strips away the complexity and gets you back to basics—reading what the market is actually doing rather than what an indicator says it might do. It’s harder at first because you can’t rely on crossing lines or colored bars to tell you what to do. You must develop the skill to read the story that price is telling.
But this difficulty is precisely what creates the edge. Most traders can’t or won’t put in the months of practice required to read price action fluently. They want the “easy” solution of indicators and systems. This means that when you develop true price action skills, you join a minority of traders who can see what others miss.
The charts are speaking. They’re telling you where institutions placed orders, where retail traders got trapped, where momentum is building or fading, and where the next high-probability move is likely to occur. But like any language, you must study it diligently to become fluent.
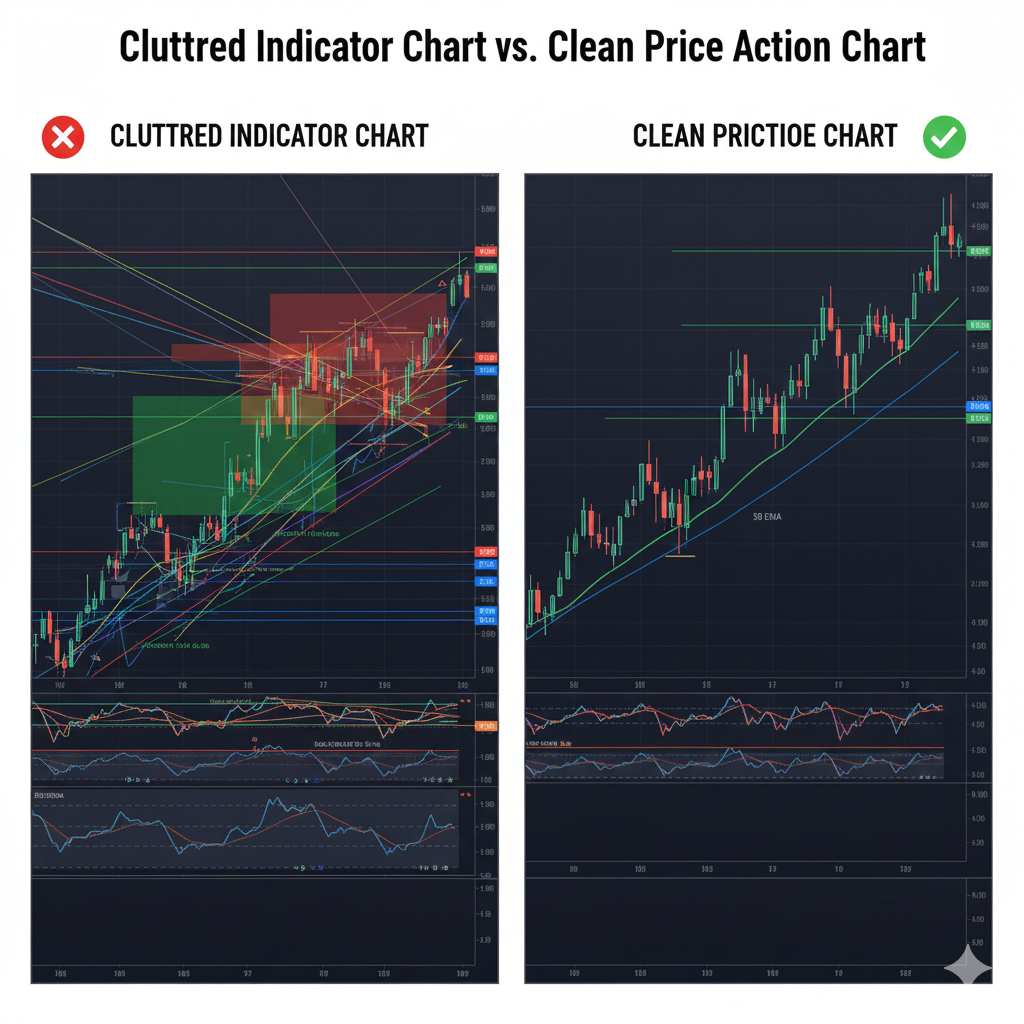
Start your price action education today. Clean off your charts, remove all indicators except perhaps the 50 and 200 EMA for trend context if you must have something, and start observing pure price movement. Study historical charts for 30 minutes daily. Identify patterns. Mark support and resistance. Analyze context.
In six months, you’ll look back at your cluttered indicator charts and wonder how you ever made sense of them. In twelve months, you’ll be reading price action fluently, spotting setups that other traders miss, and trading with the confidence that comes from understanding what the market is actually doing.
The path to price action mastery begins with a single clean chart and a commitment to learning the language of price. Your journey starts now.